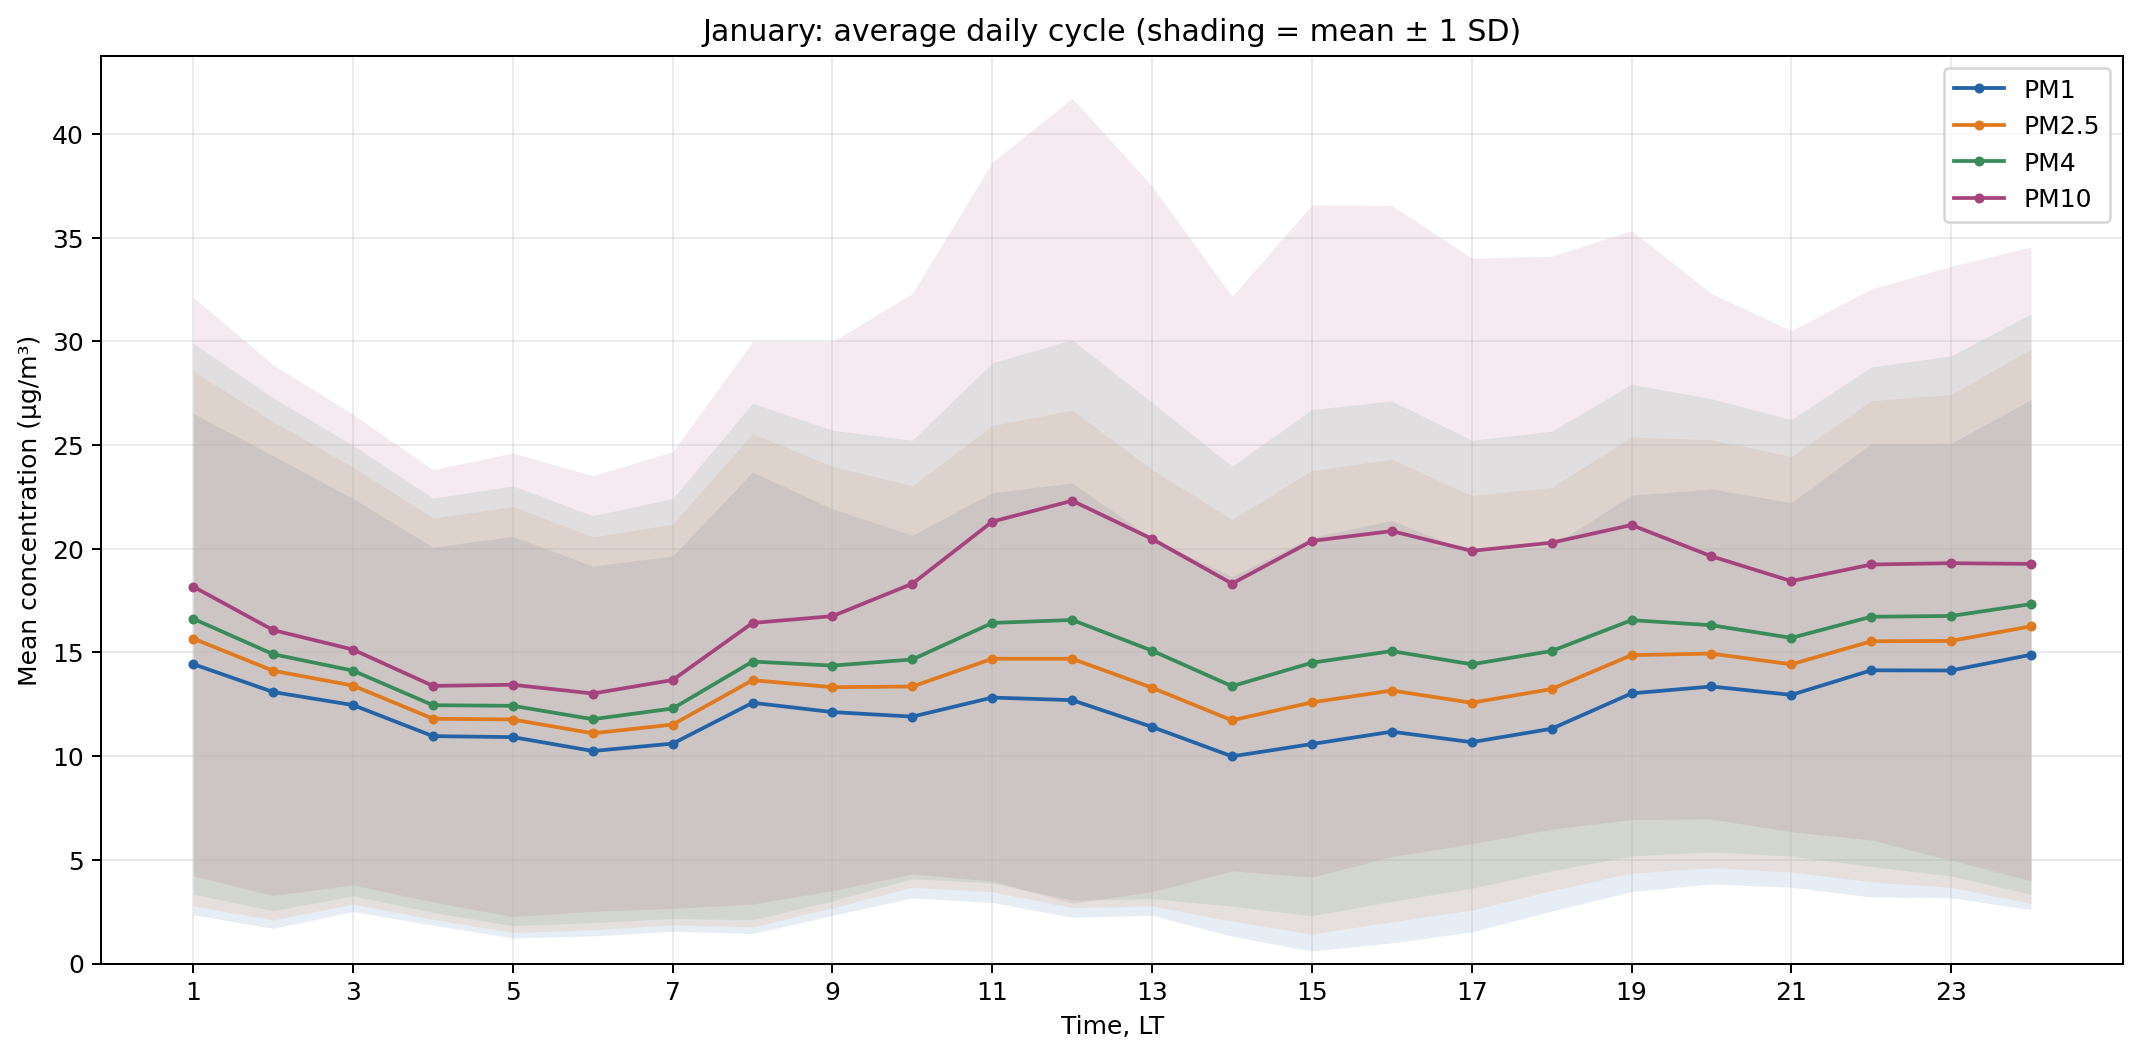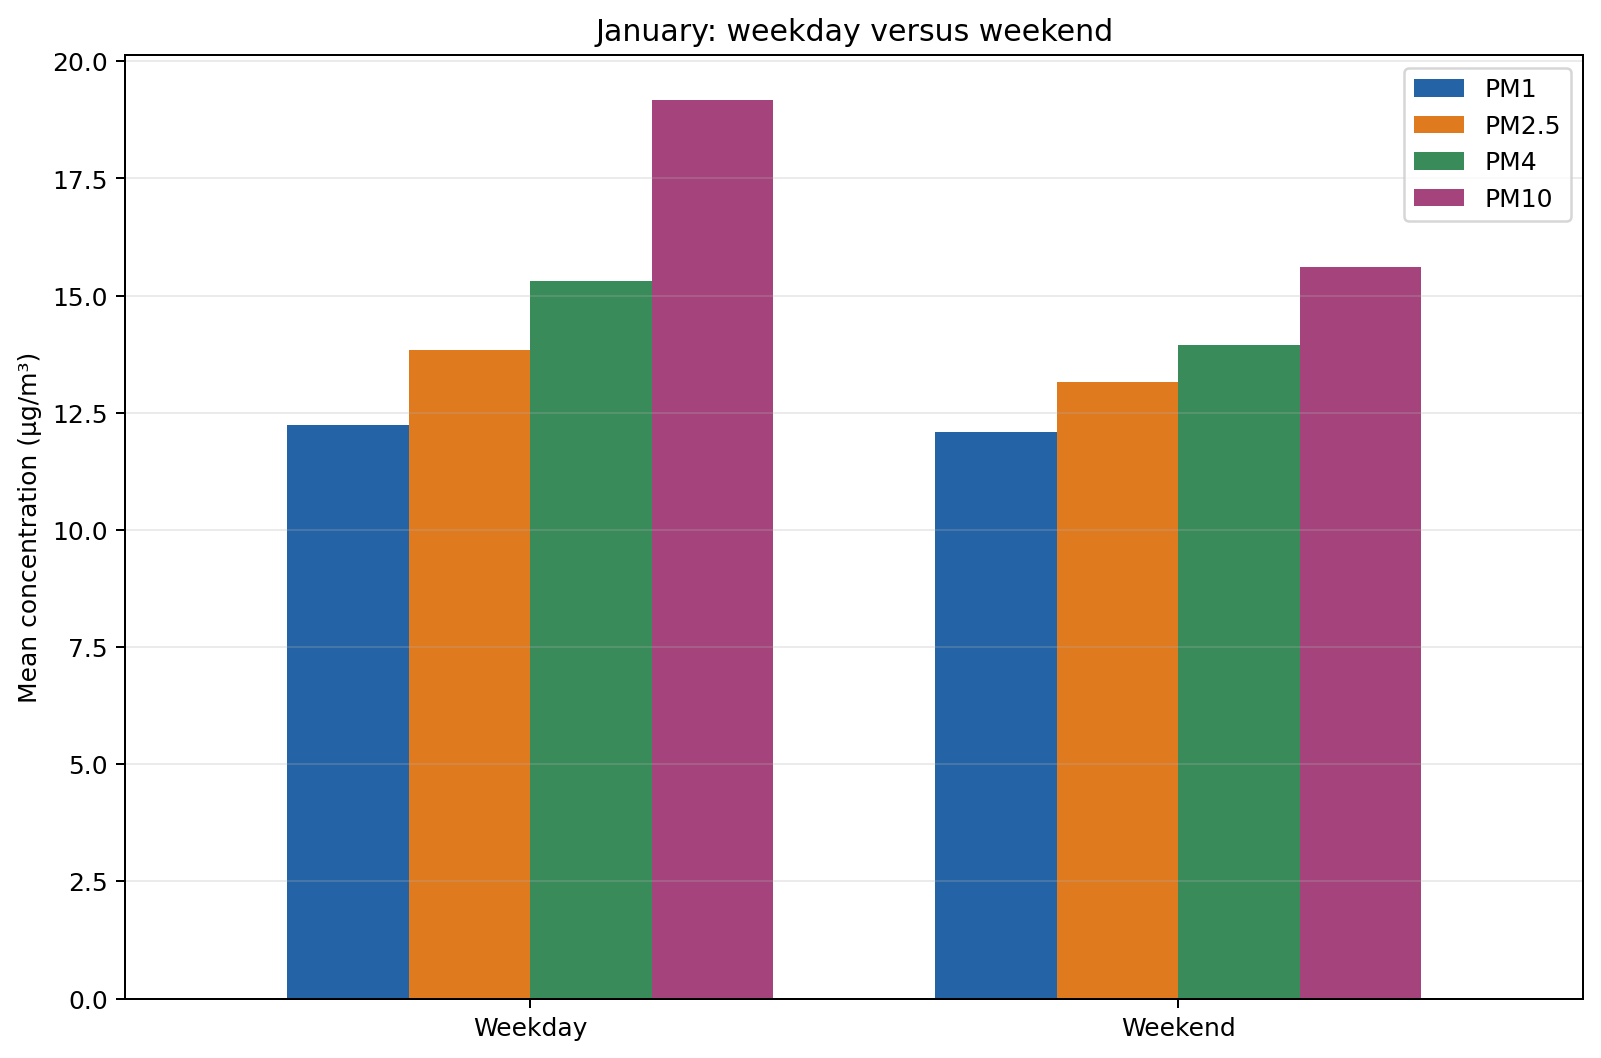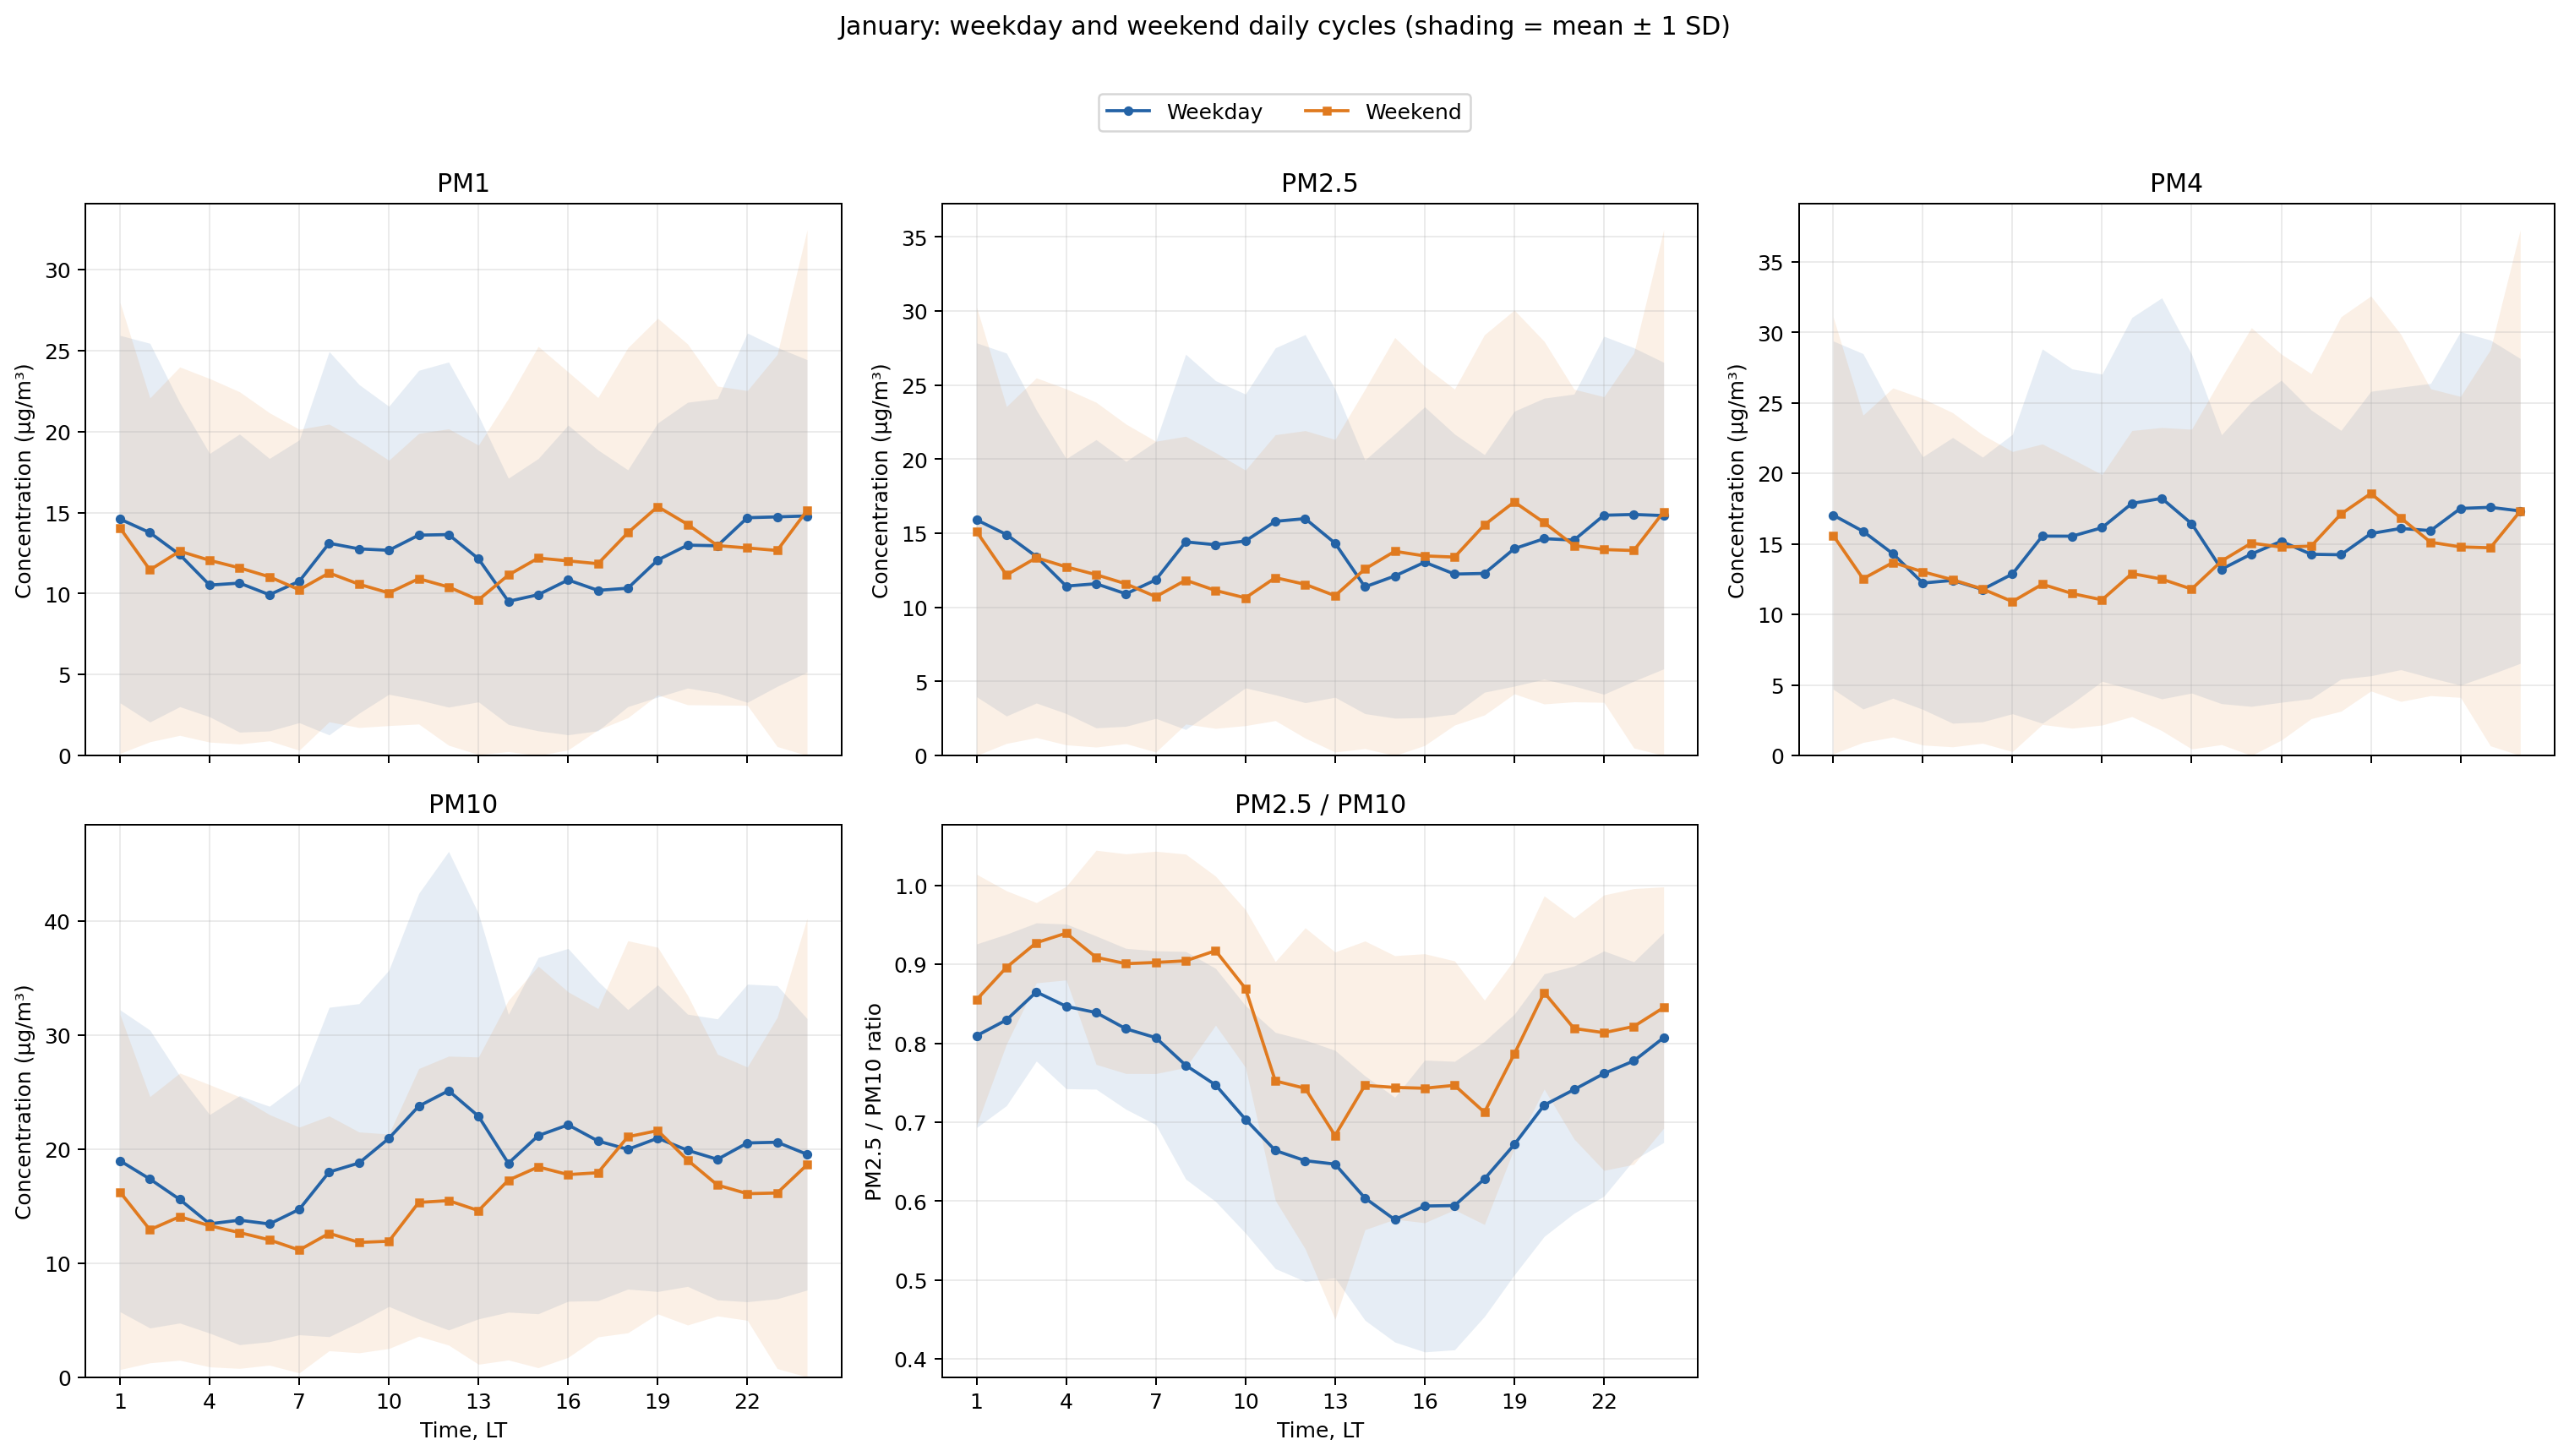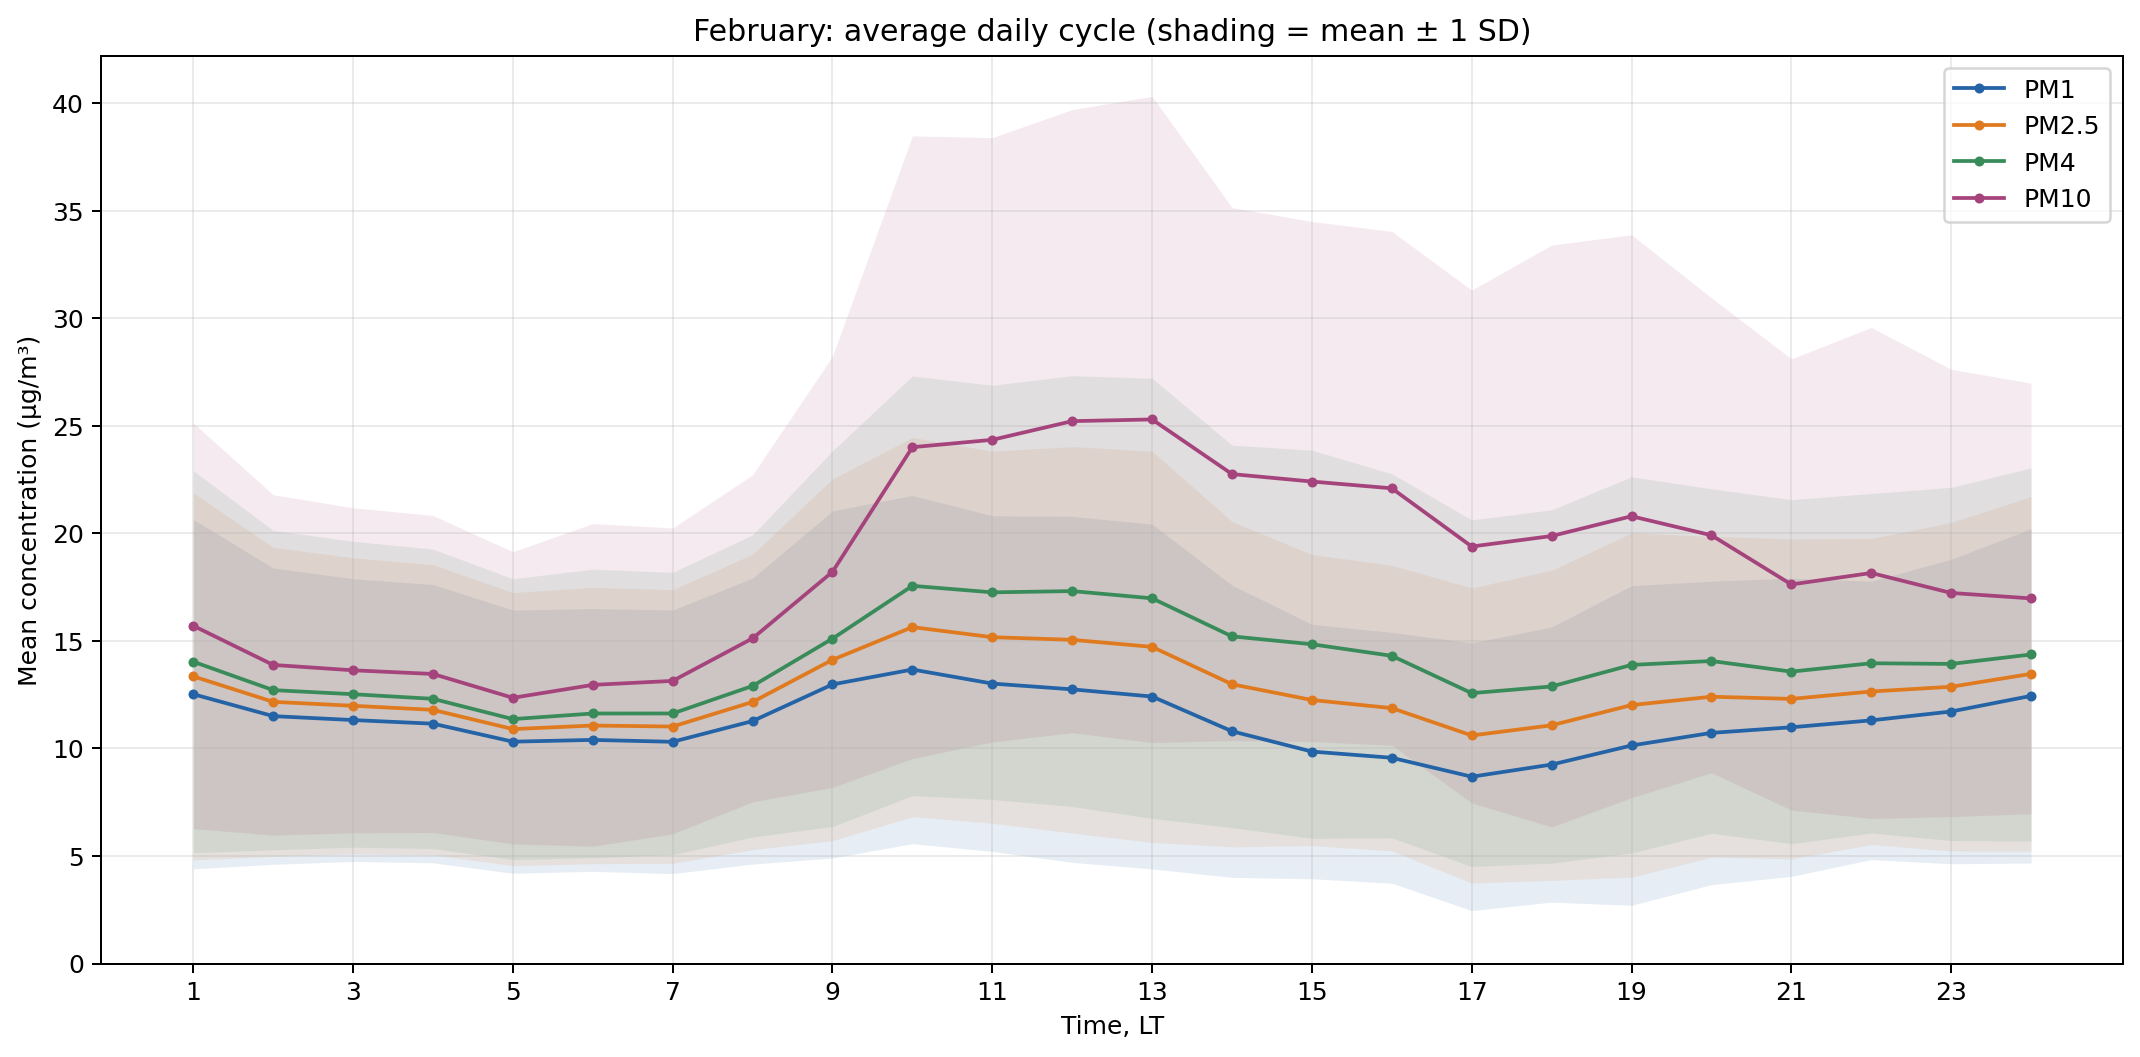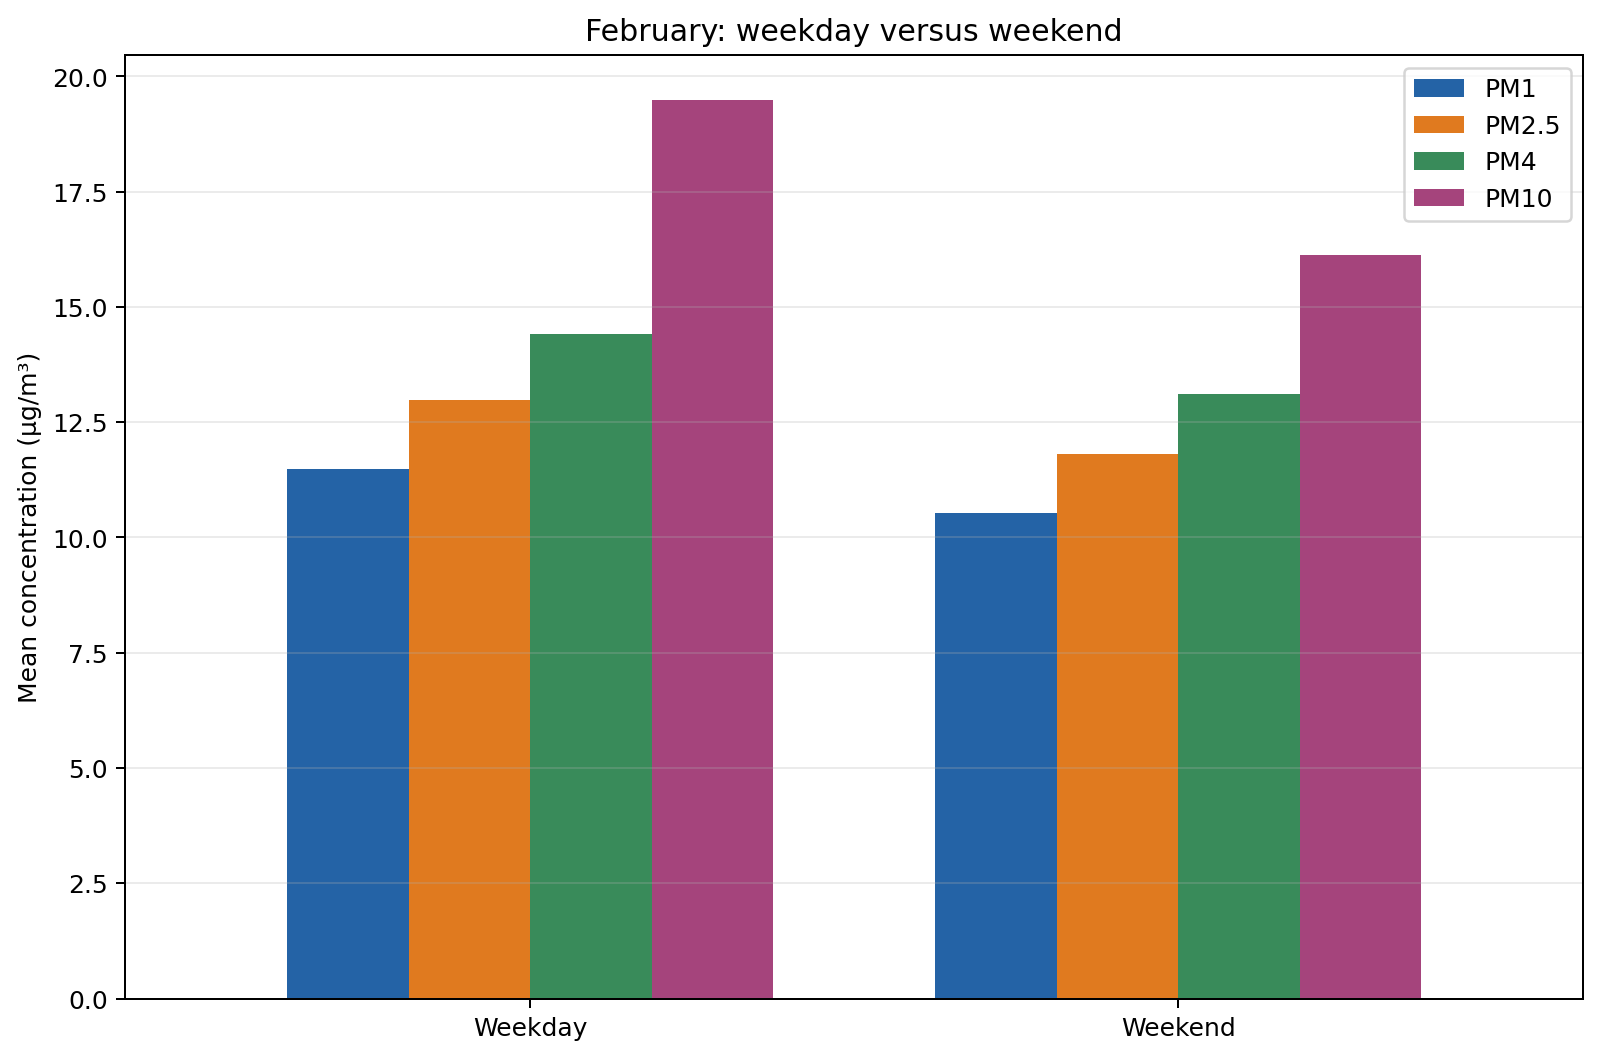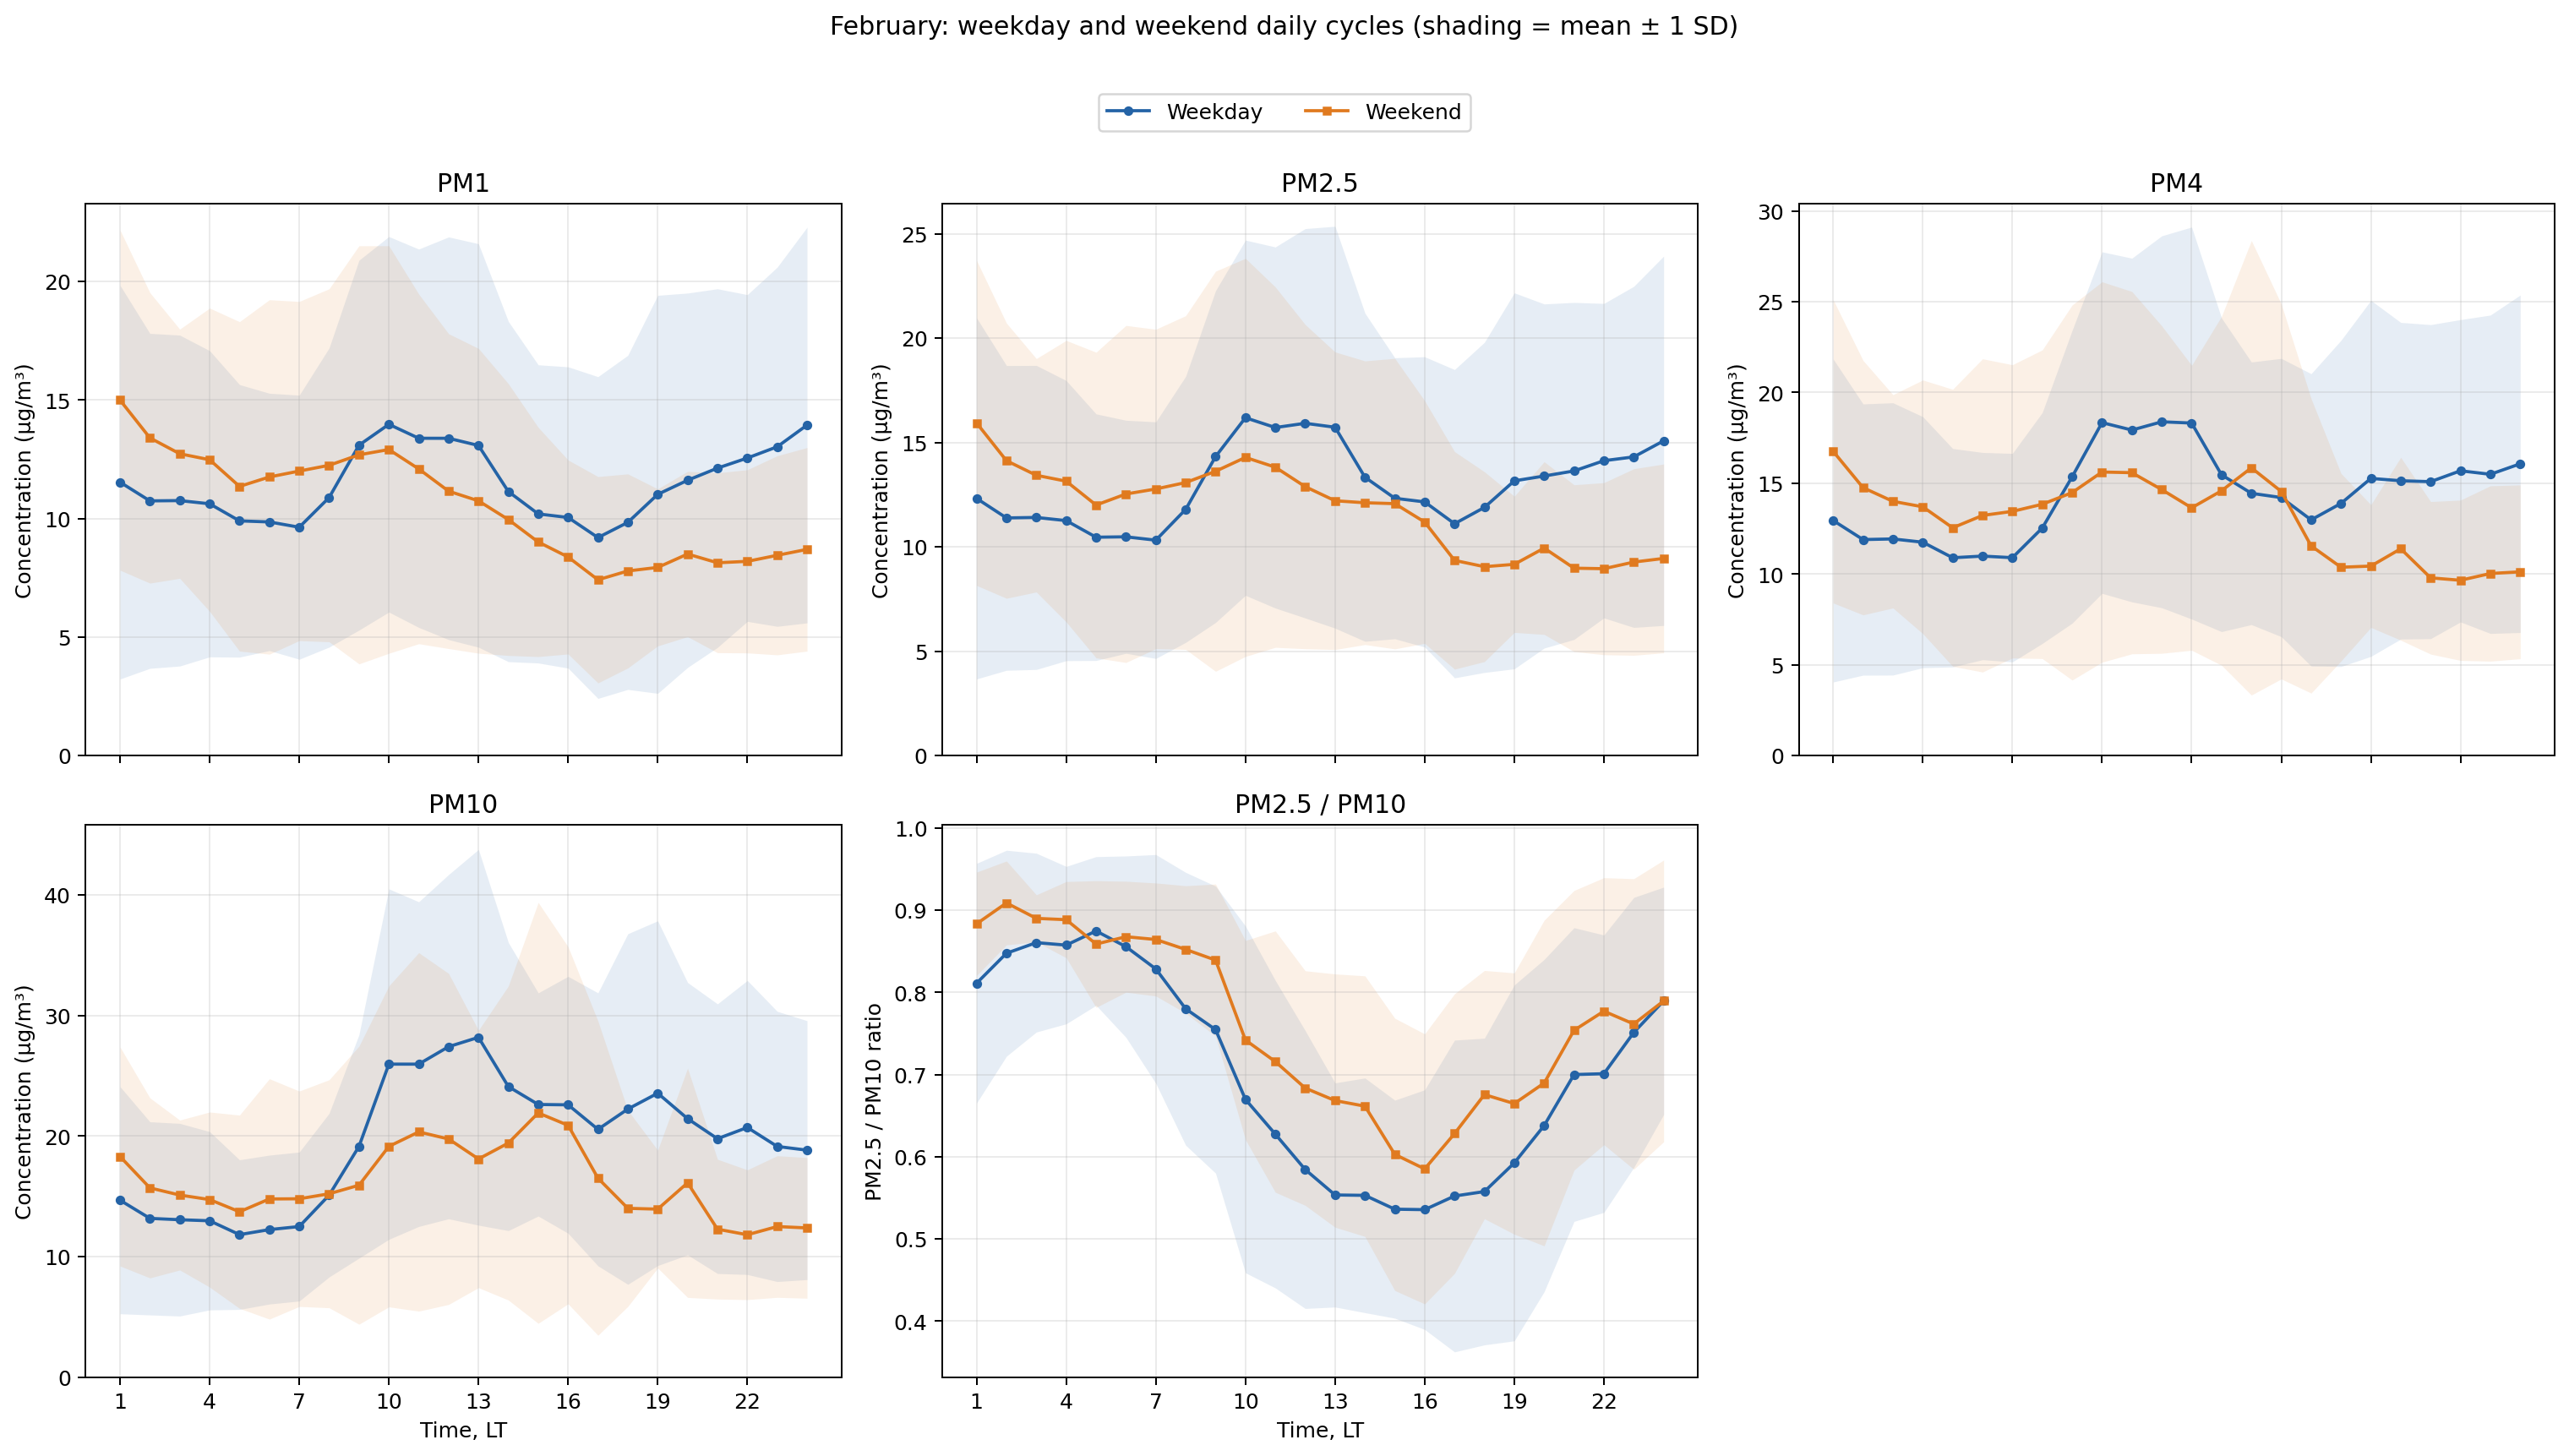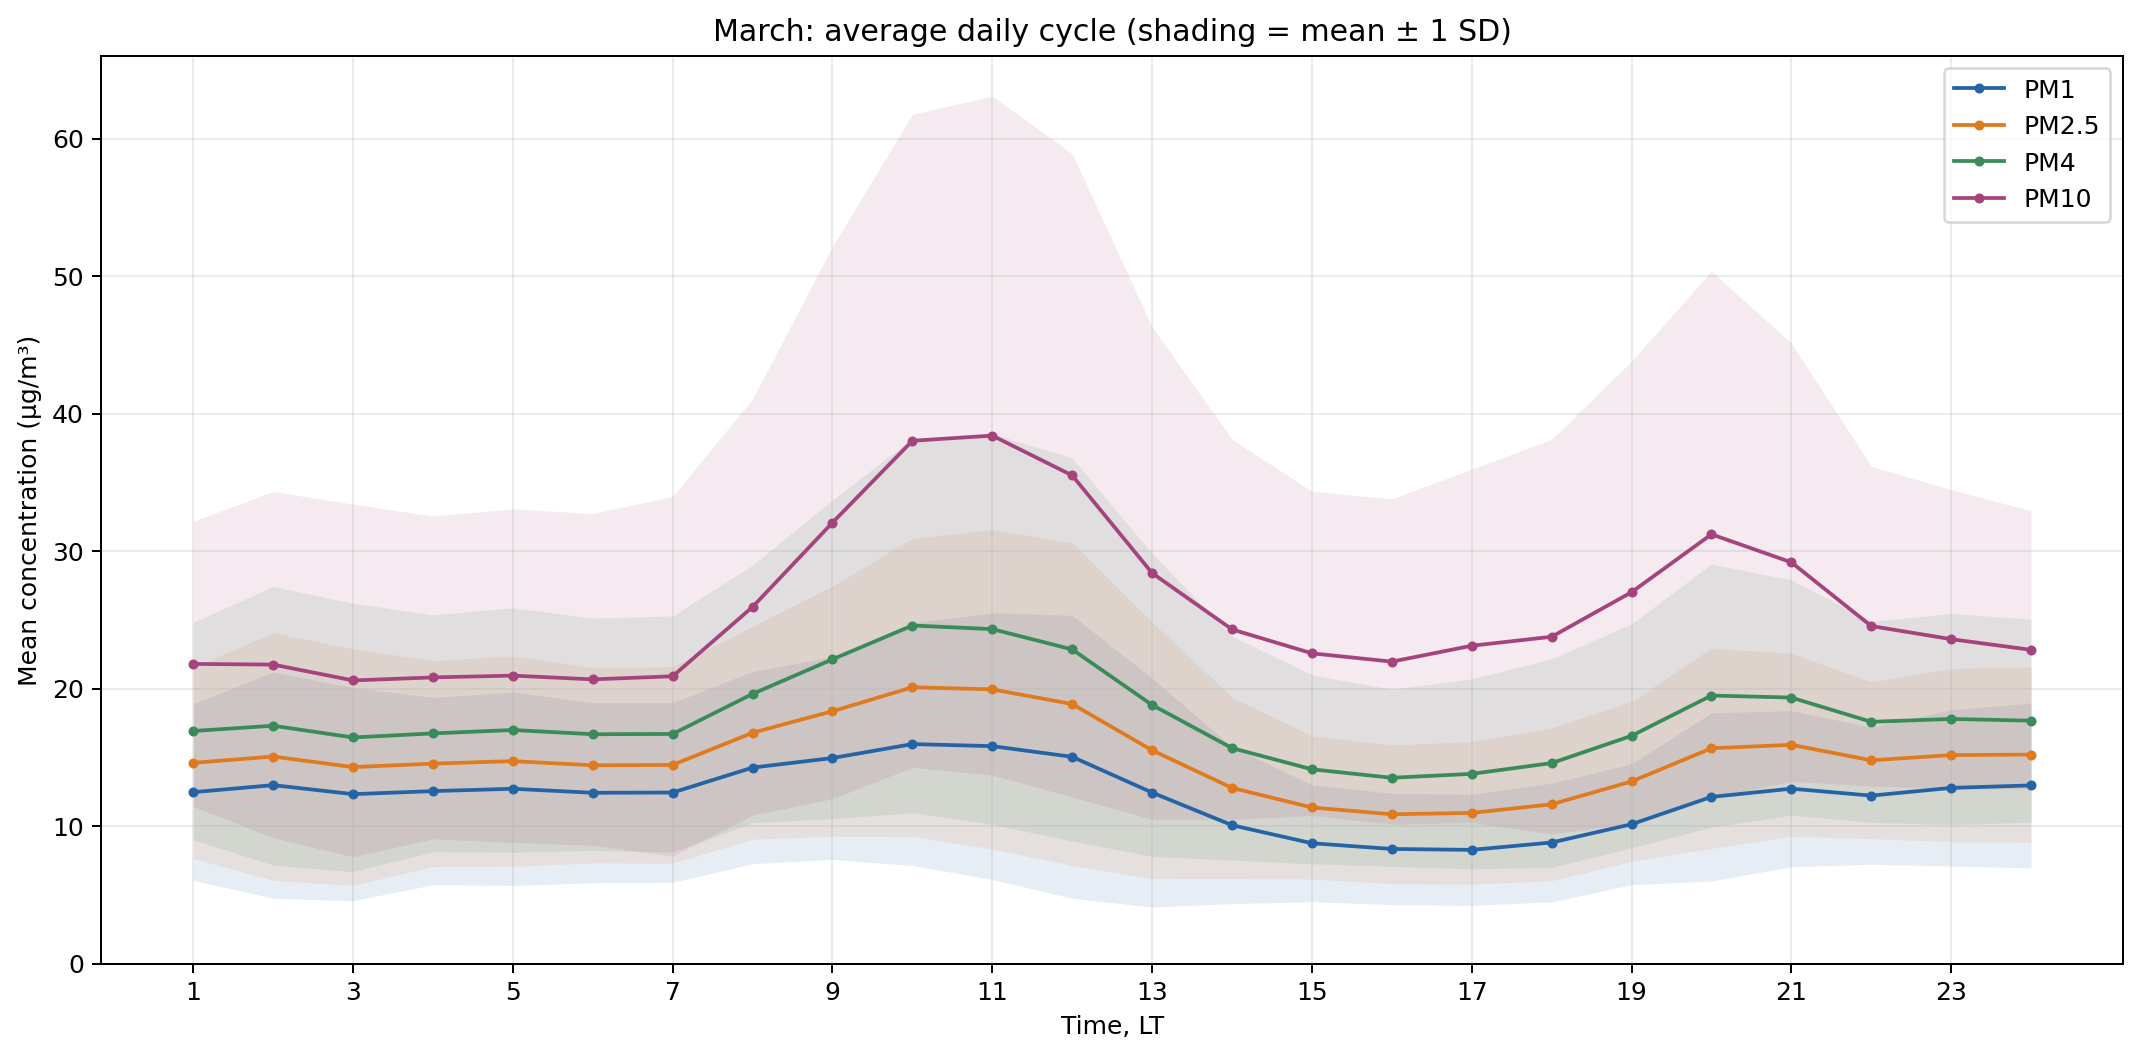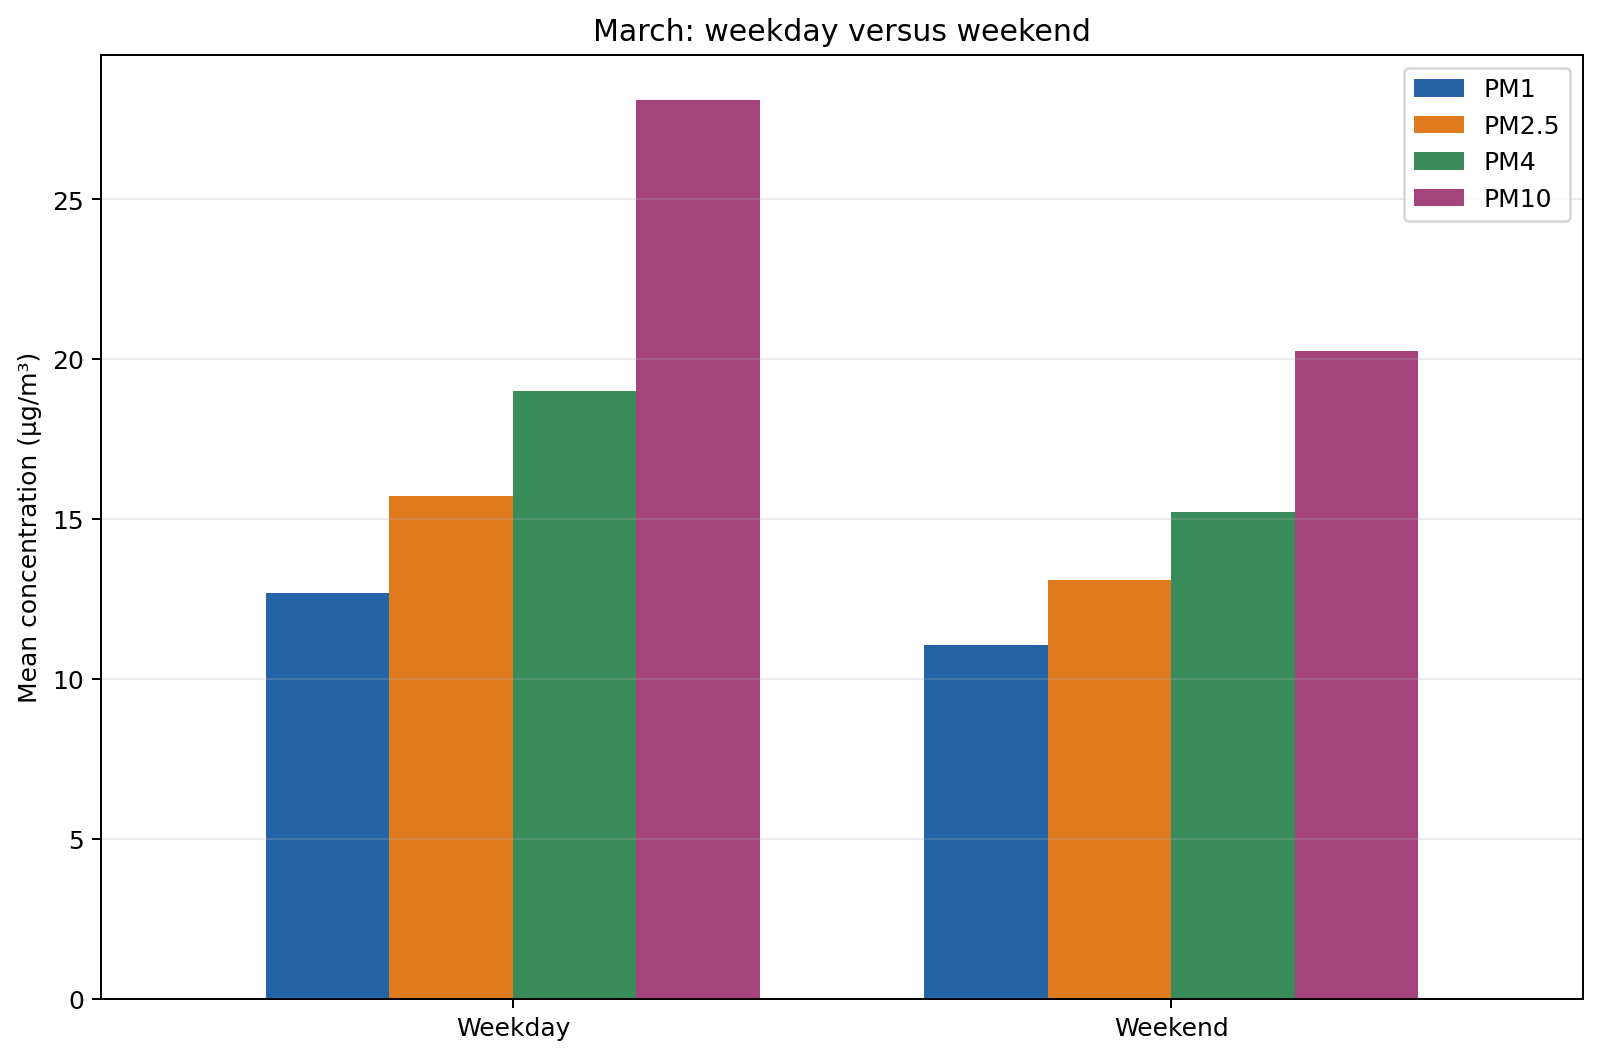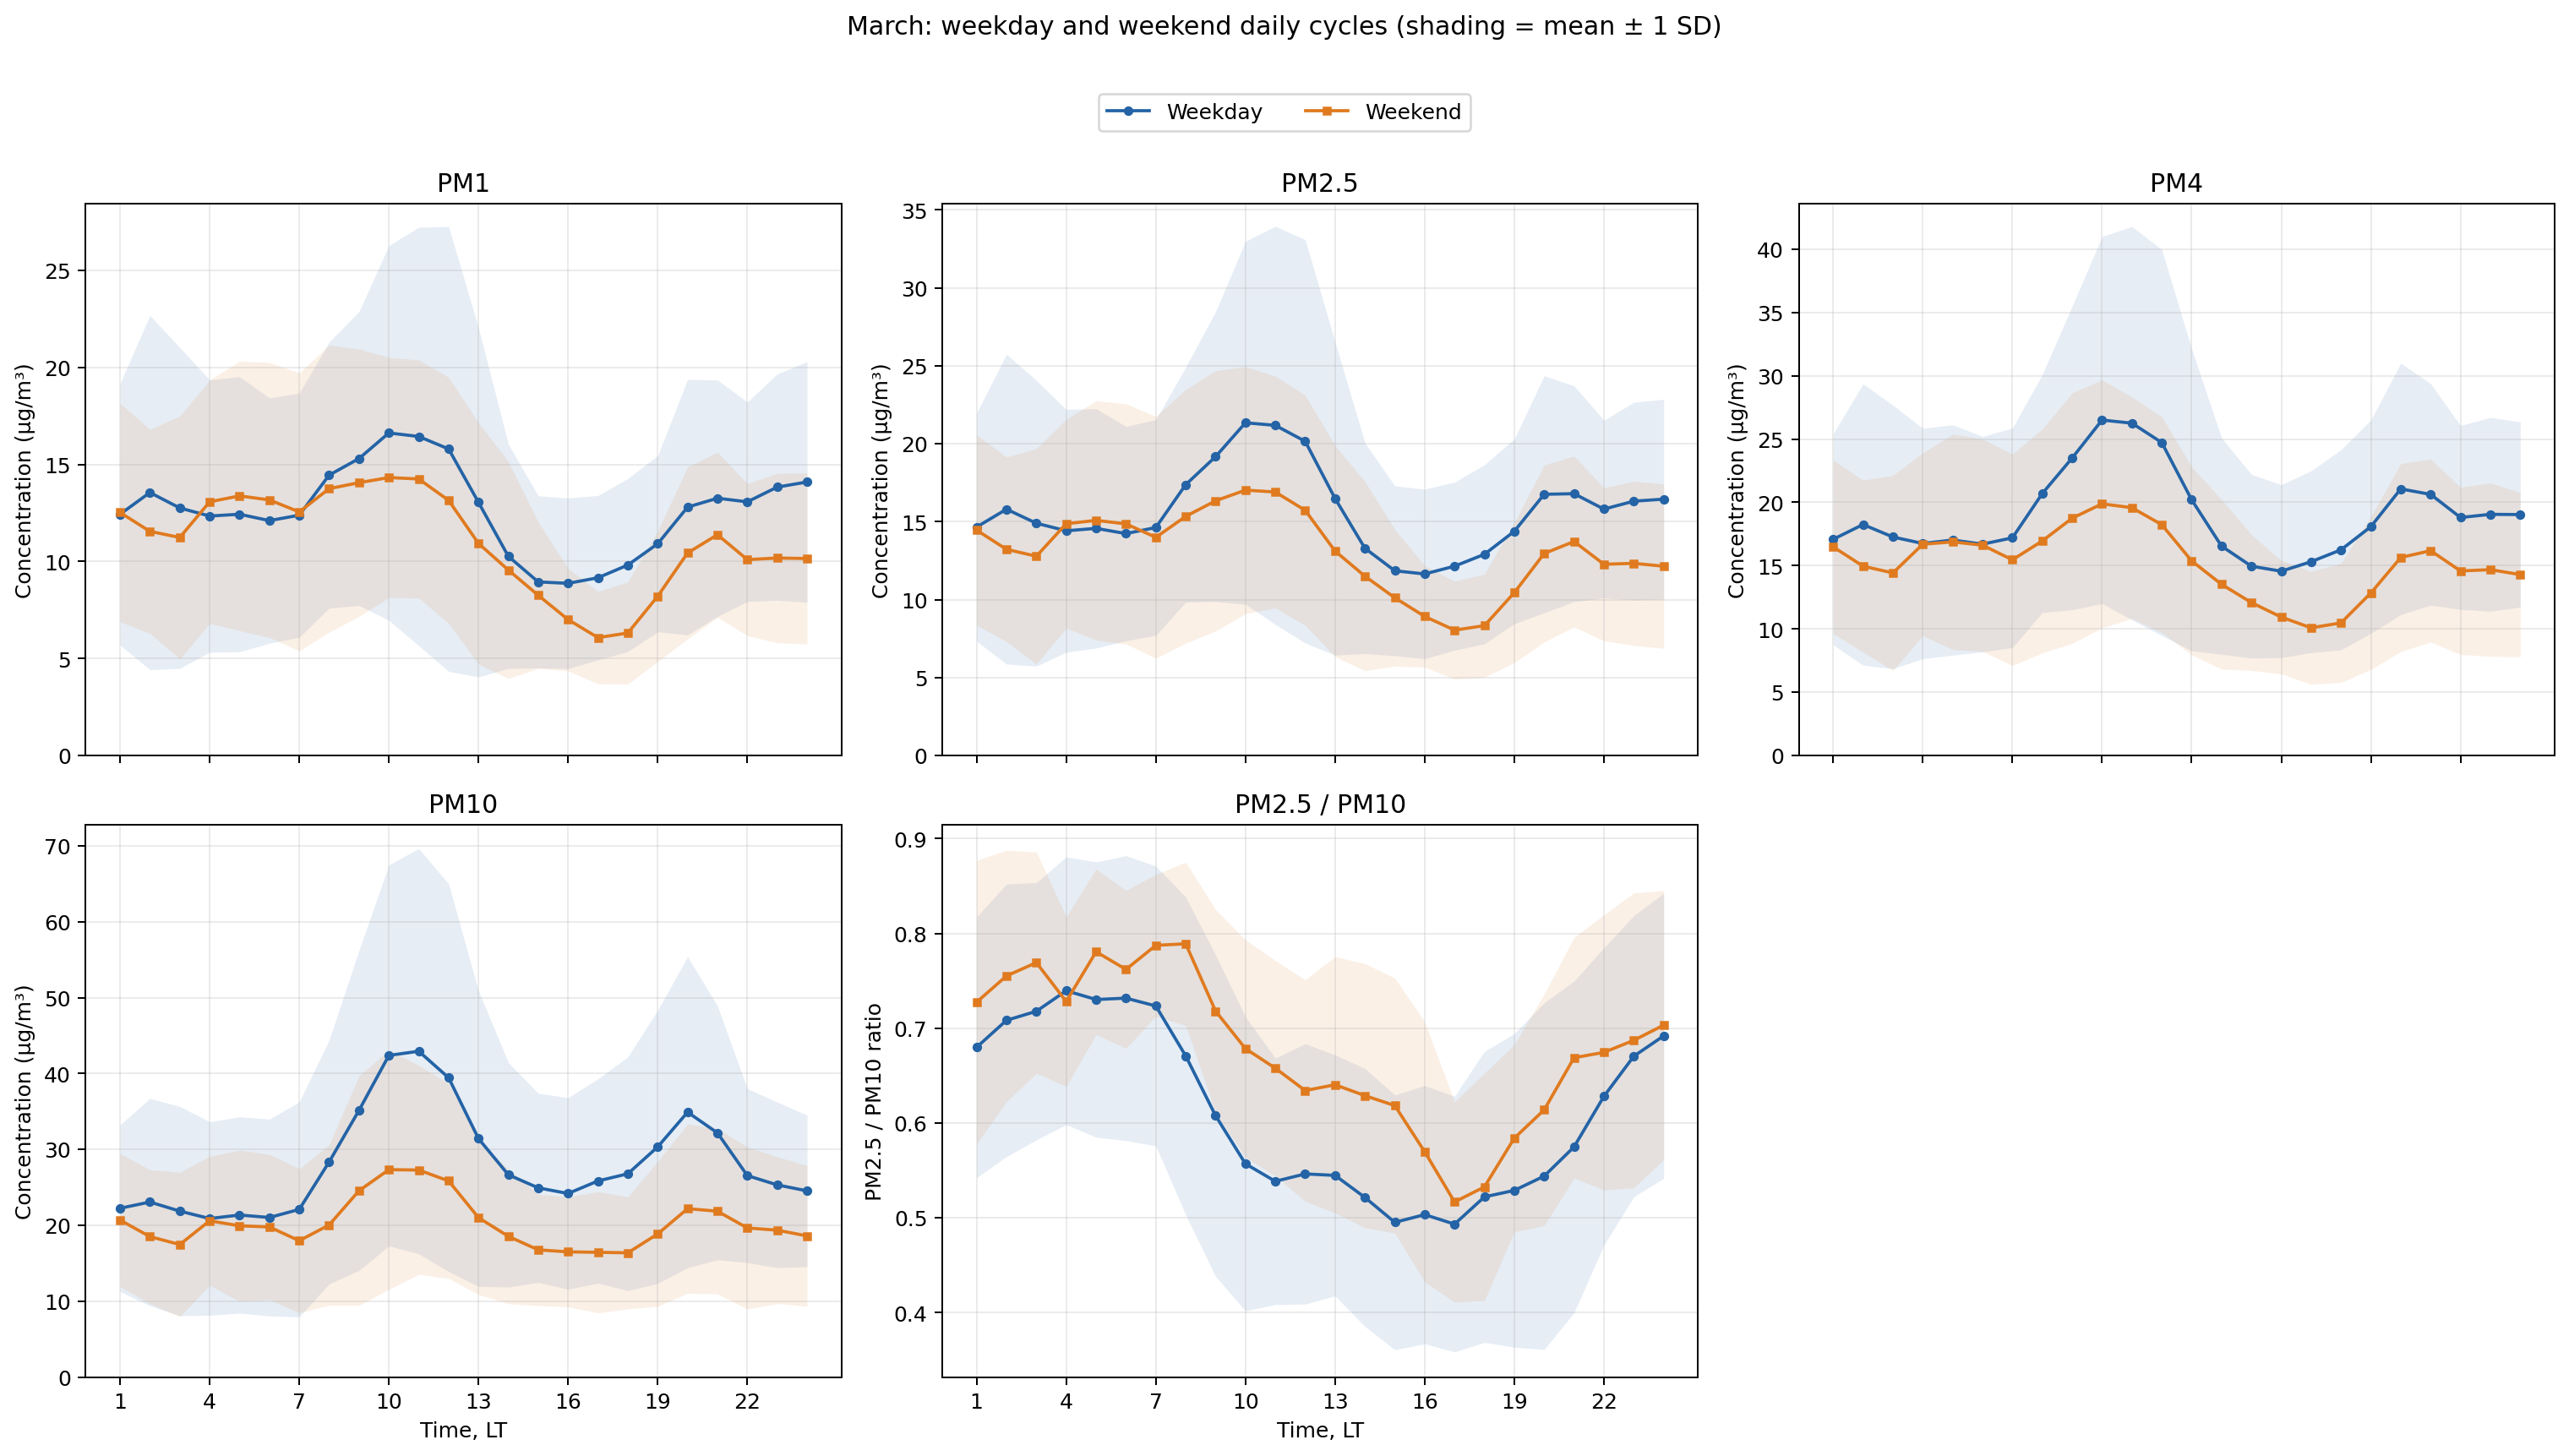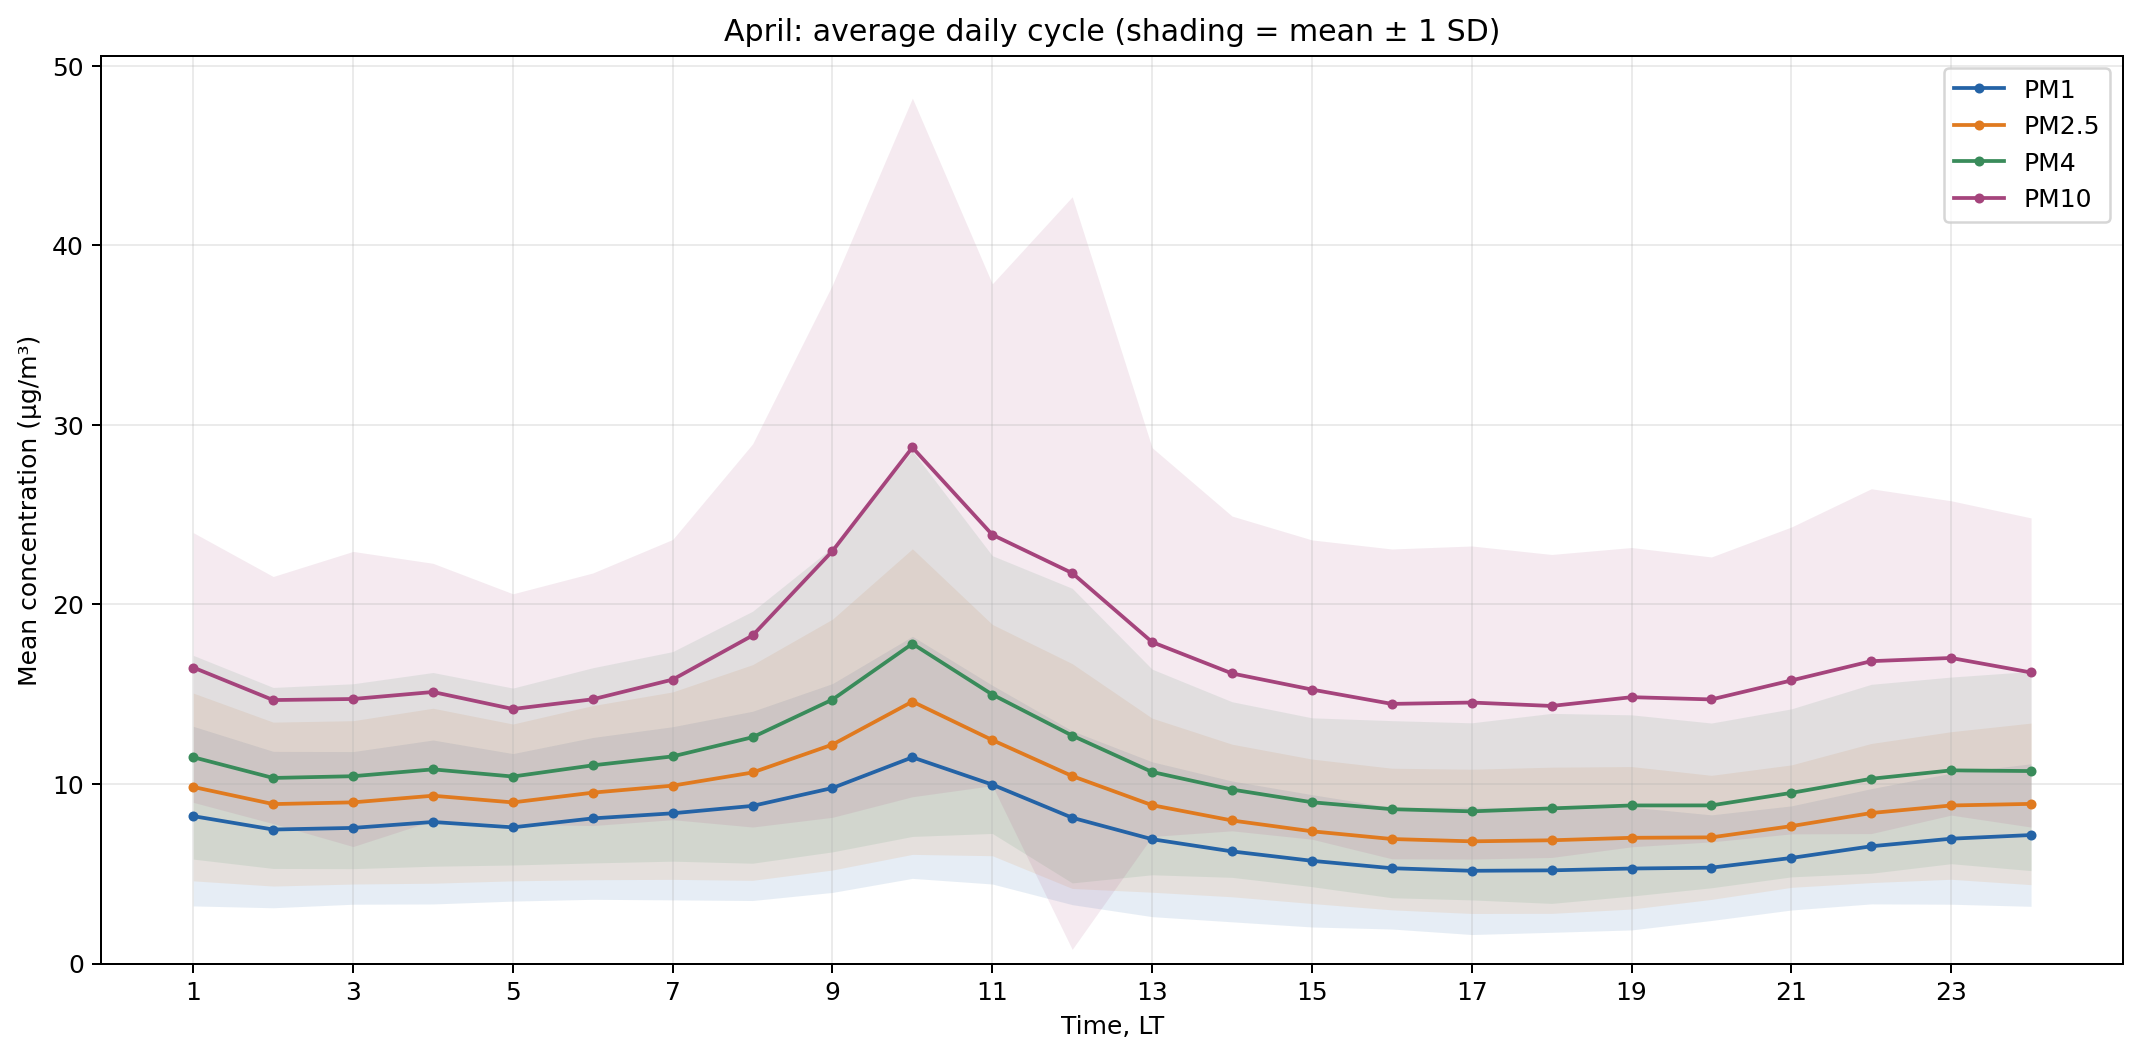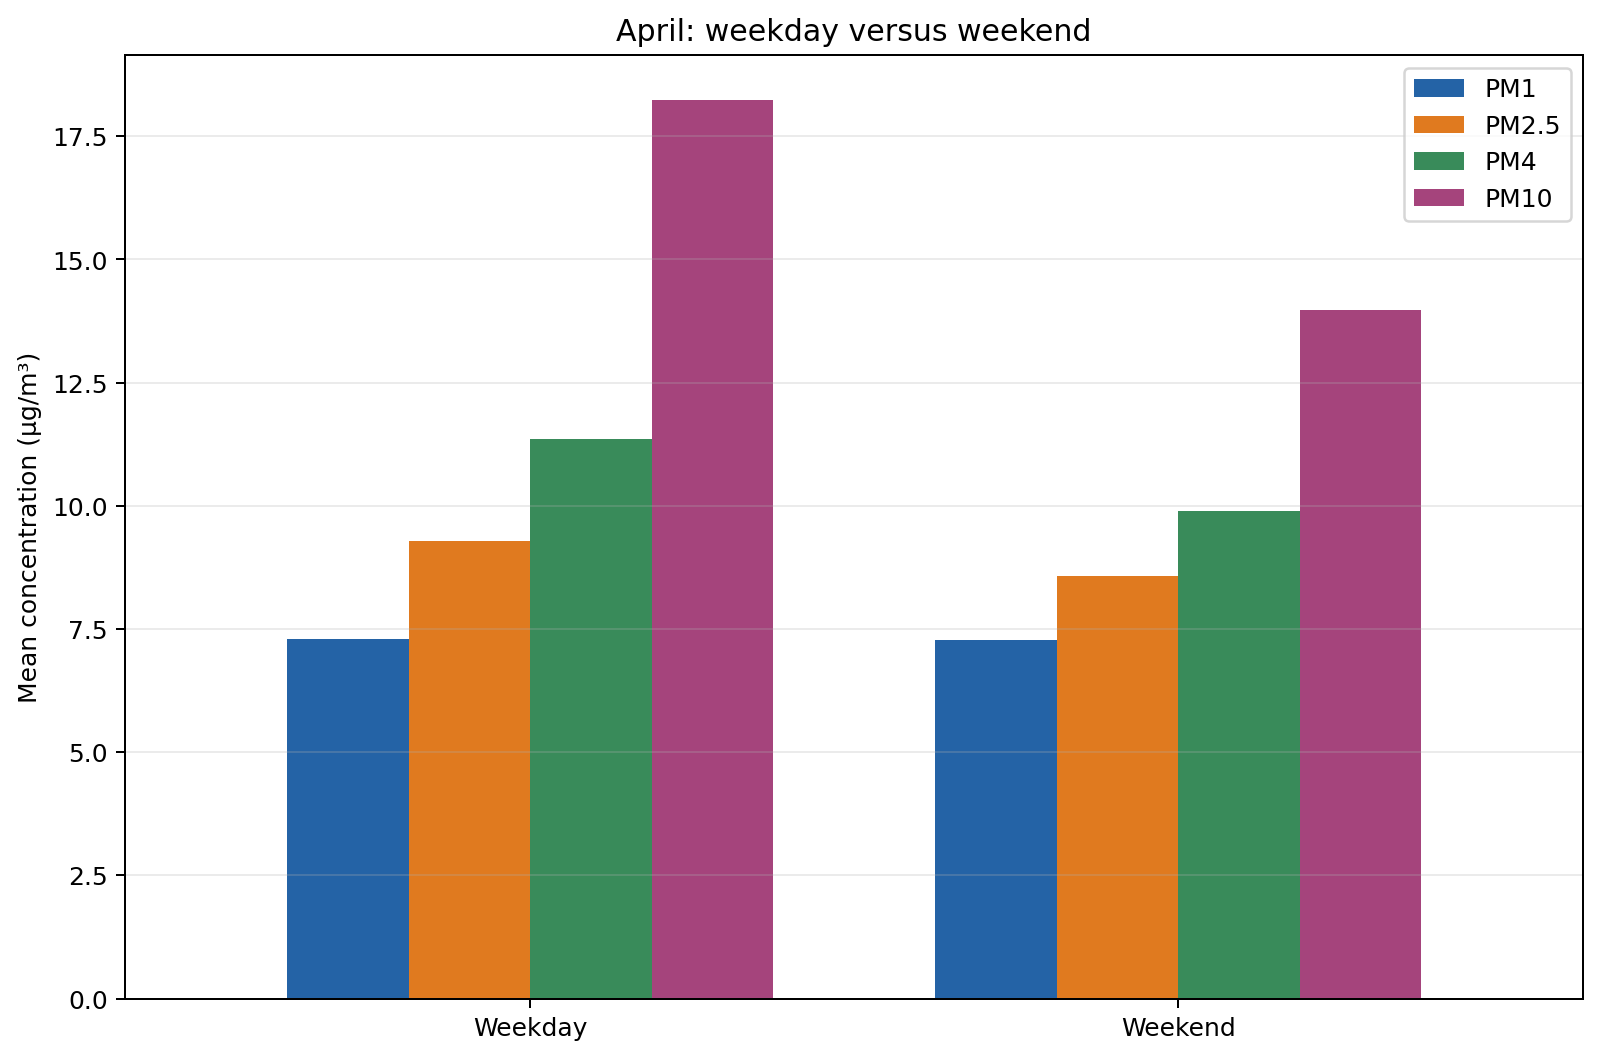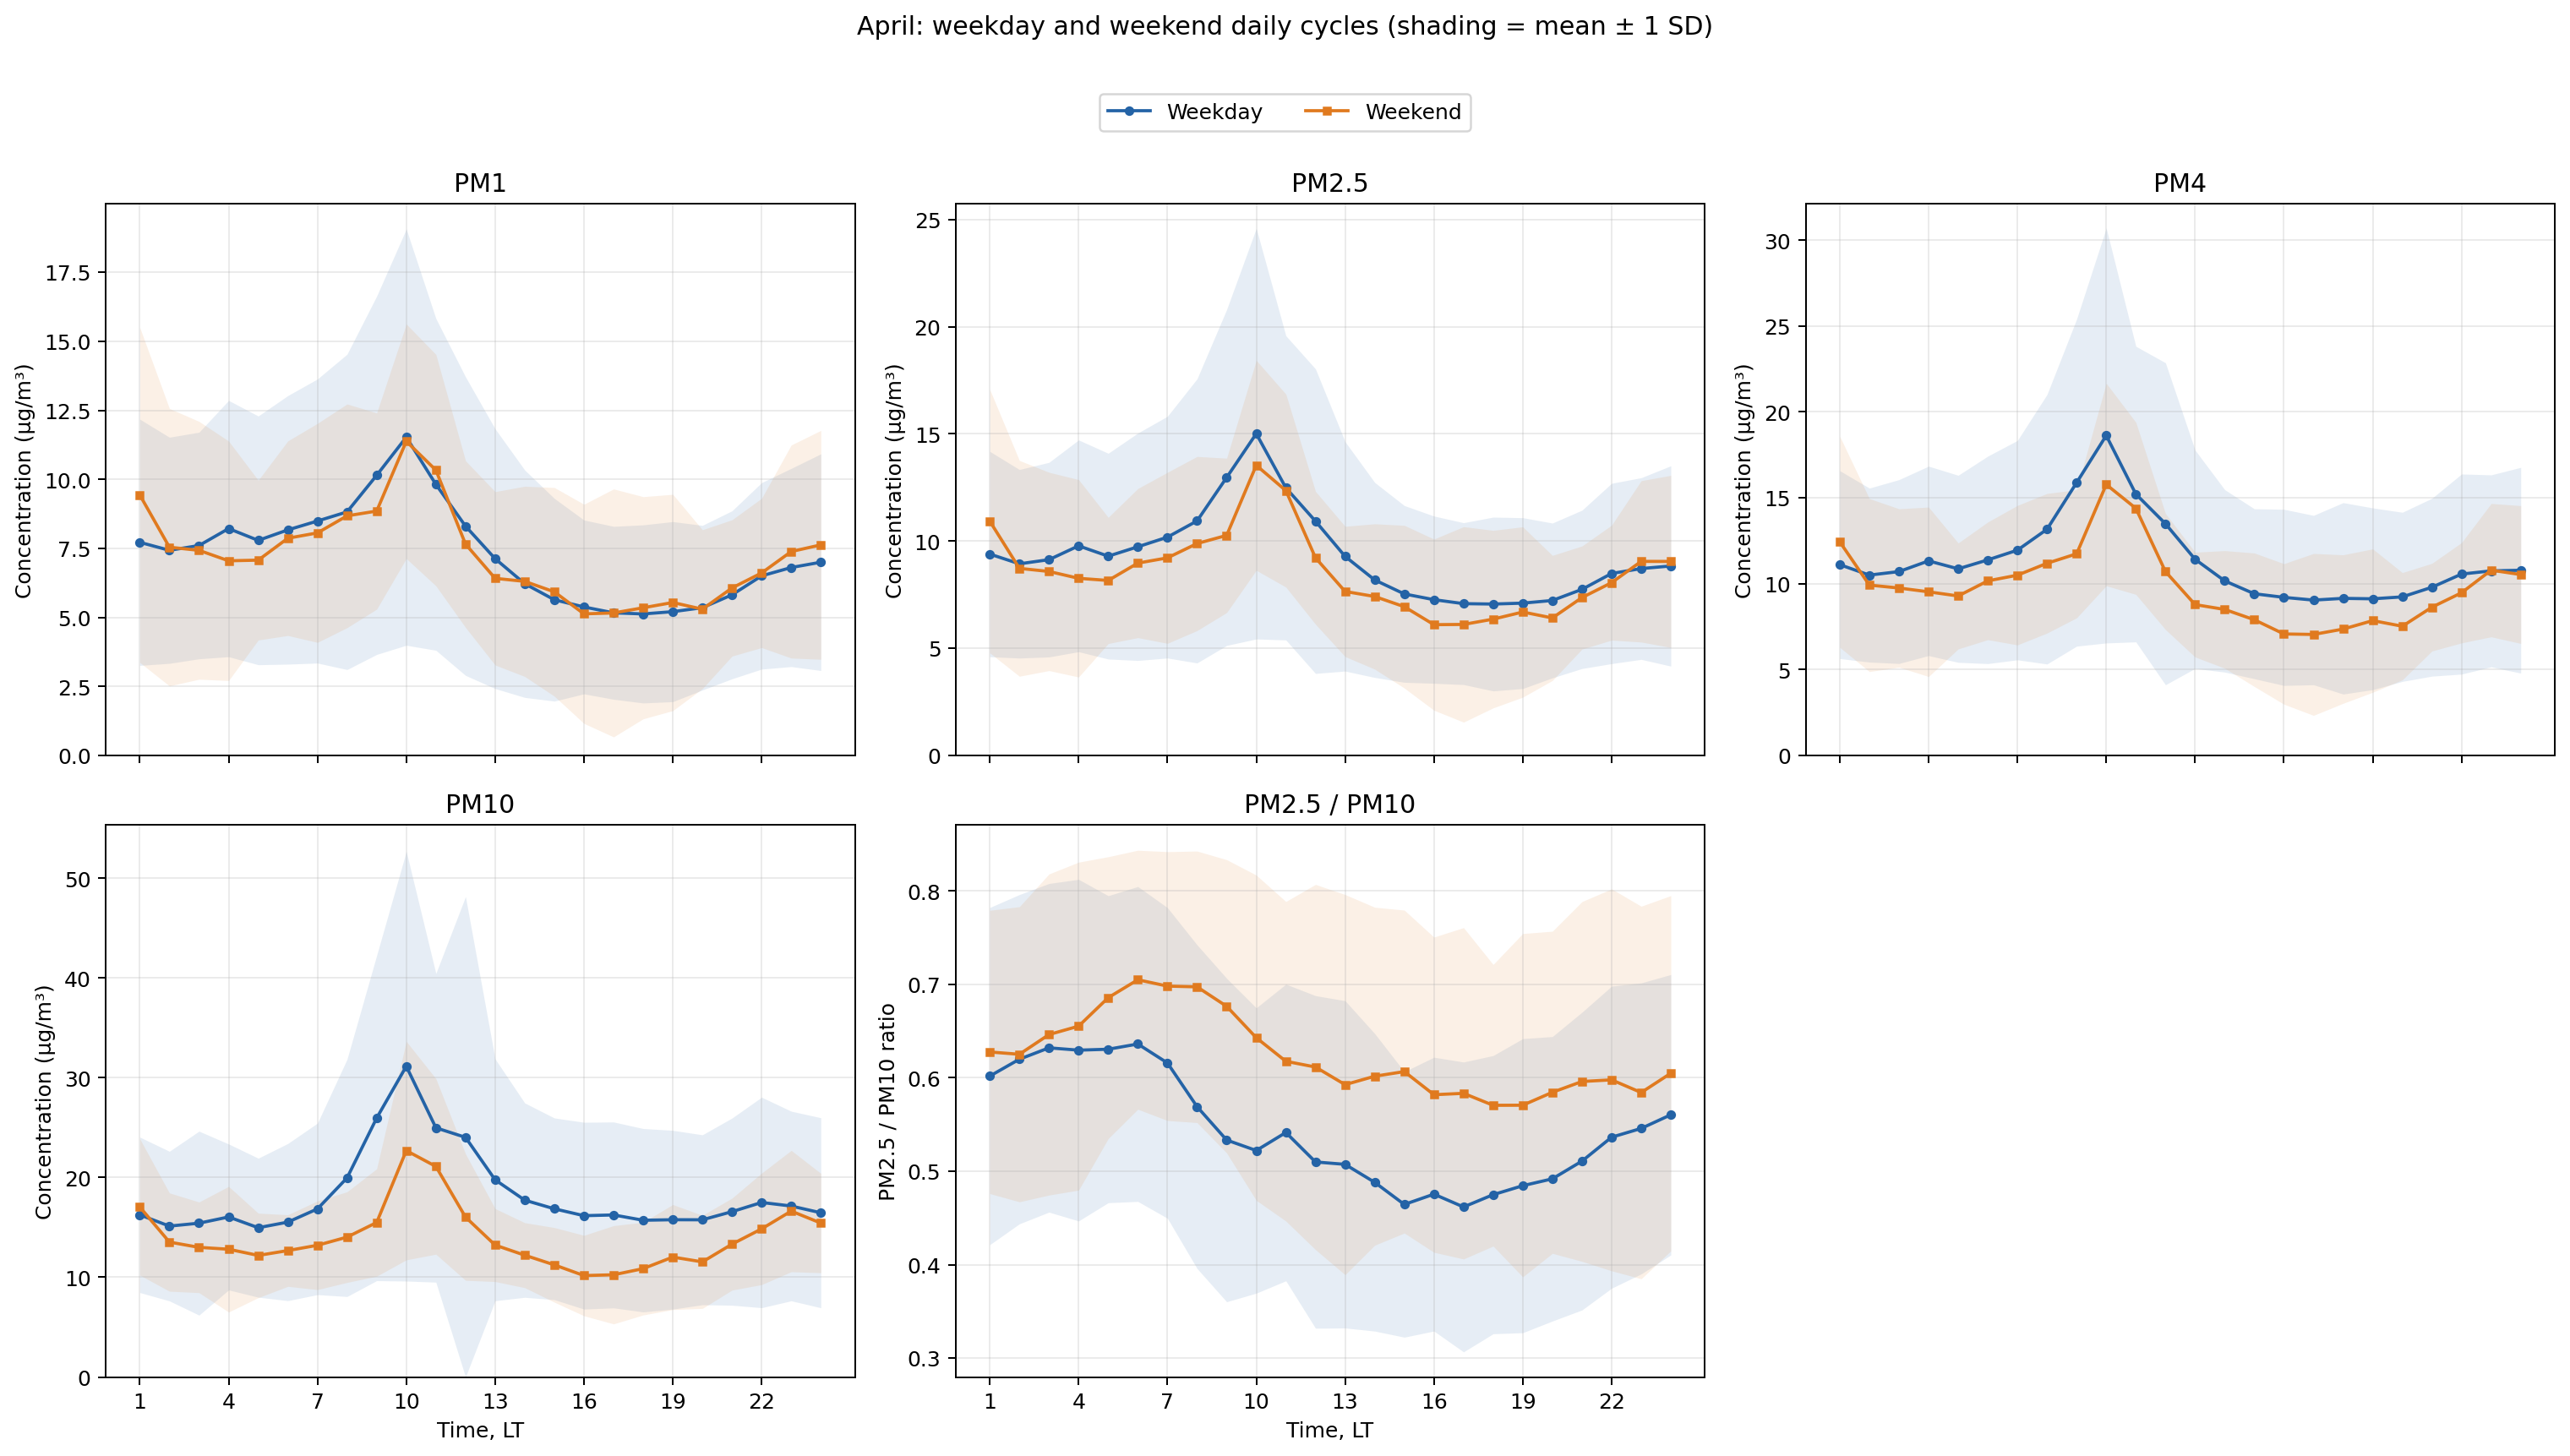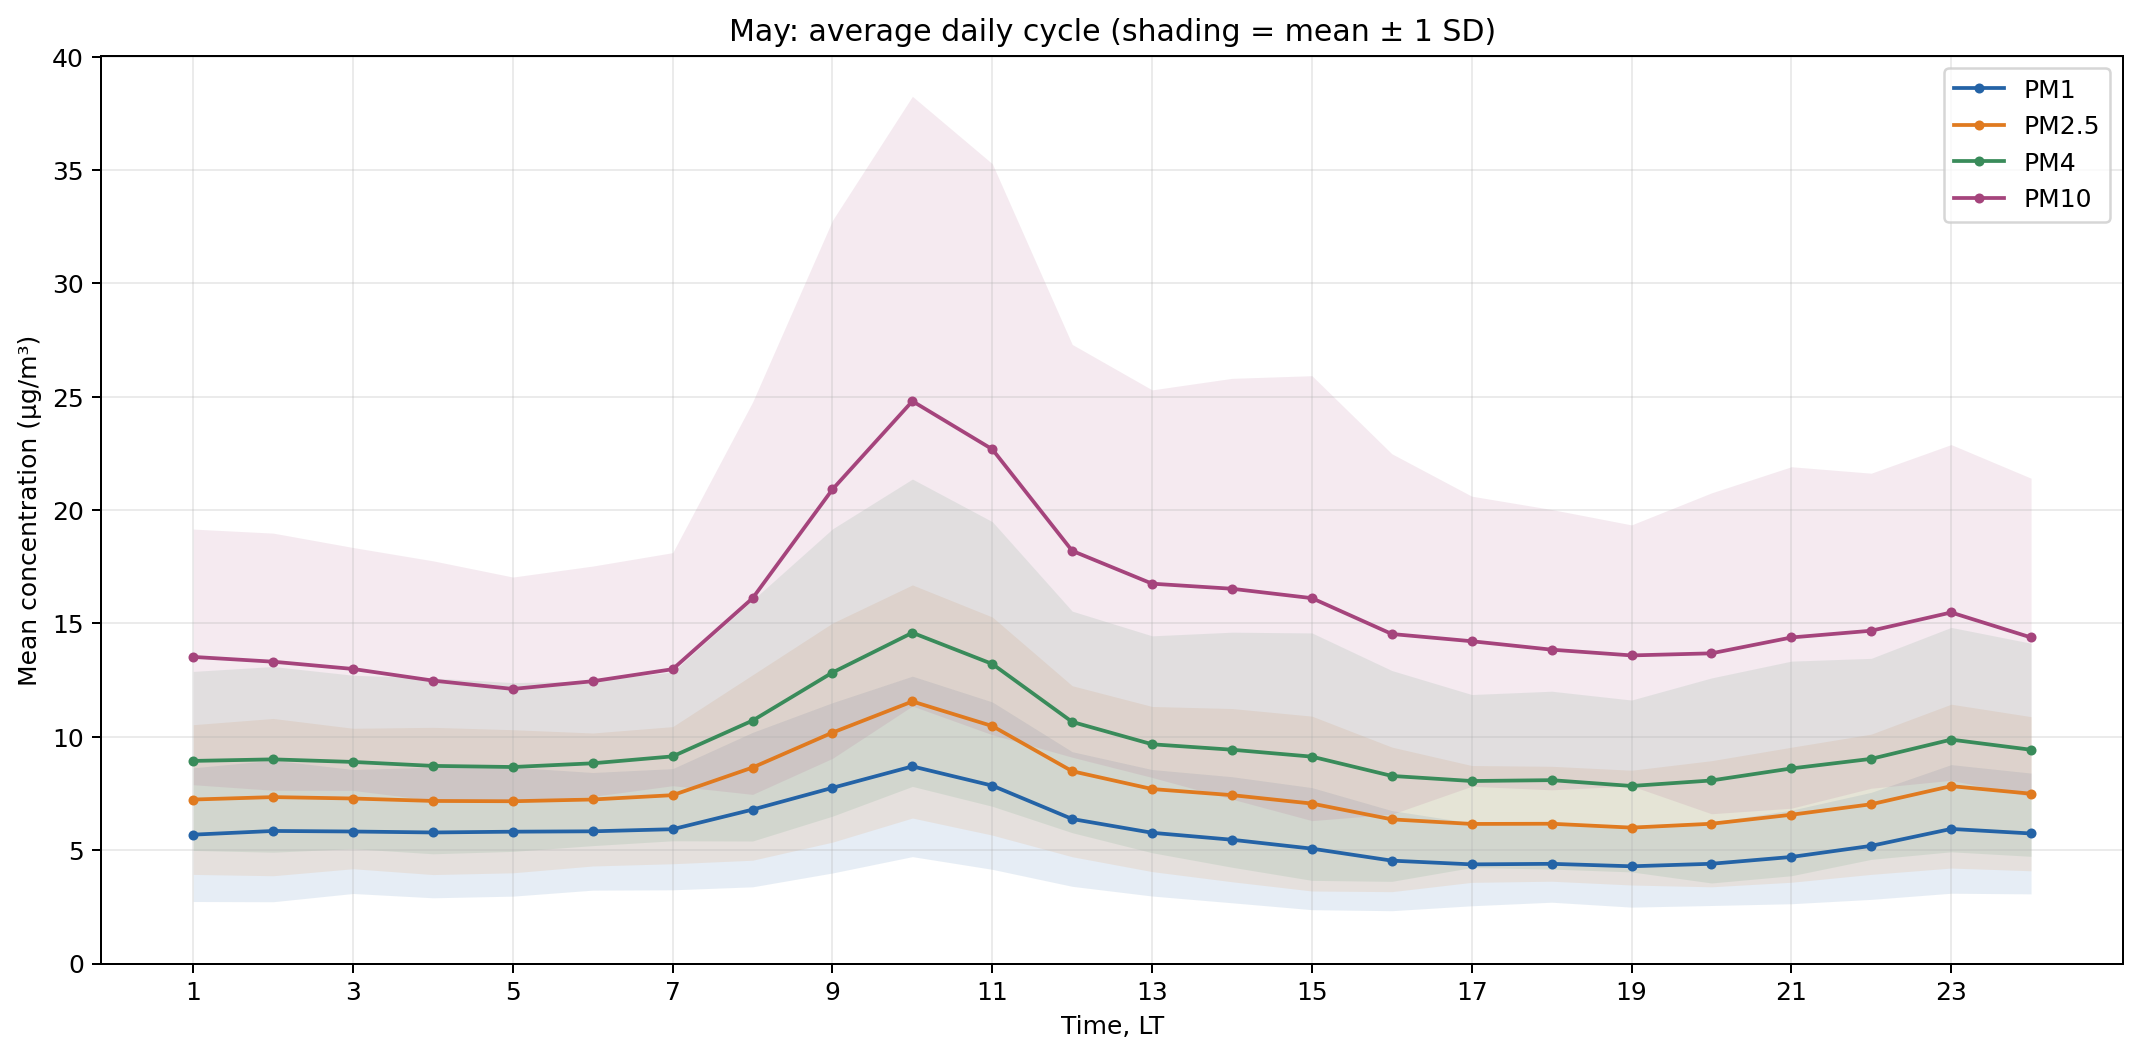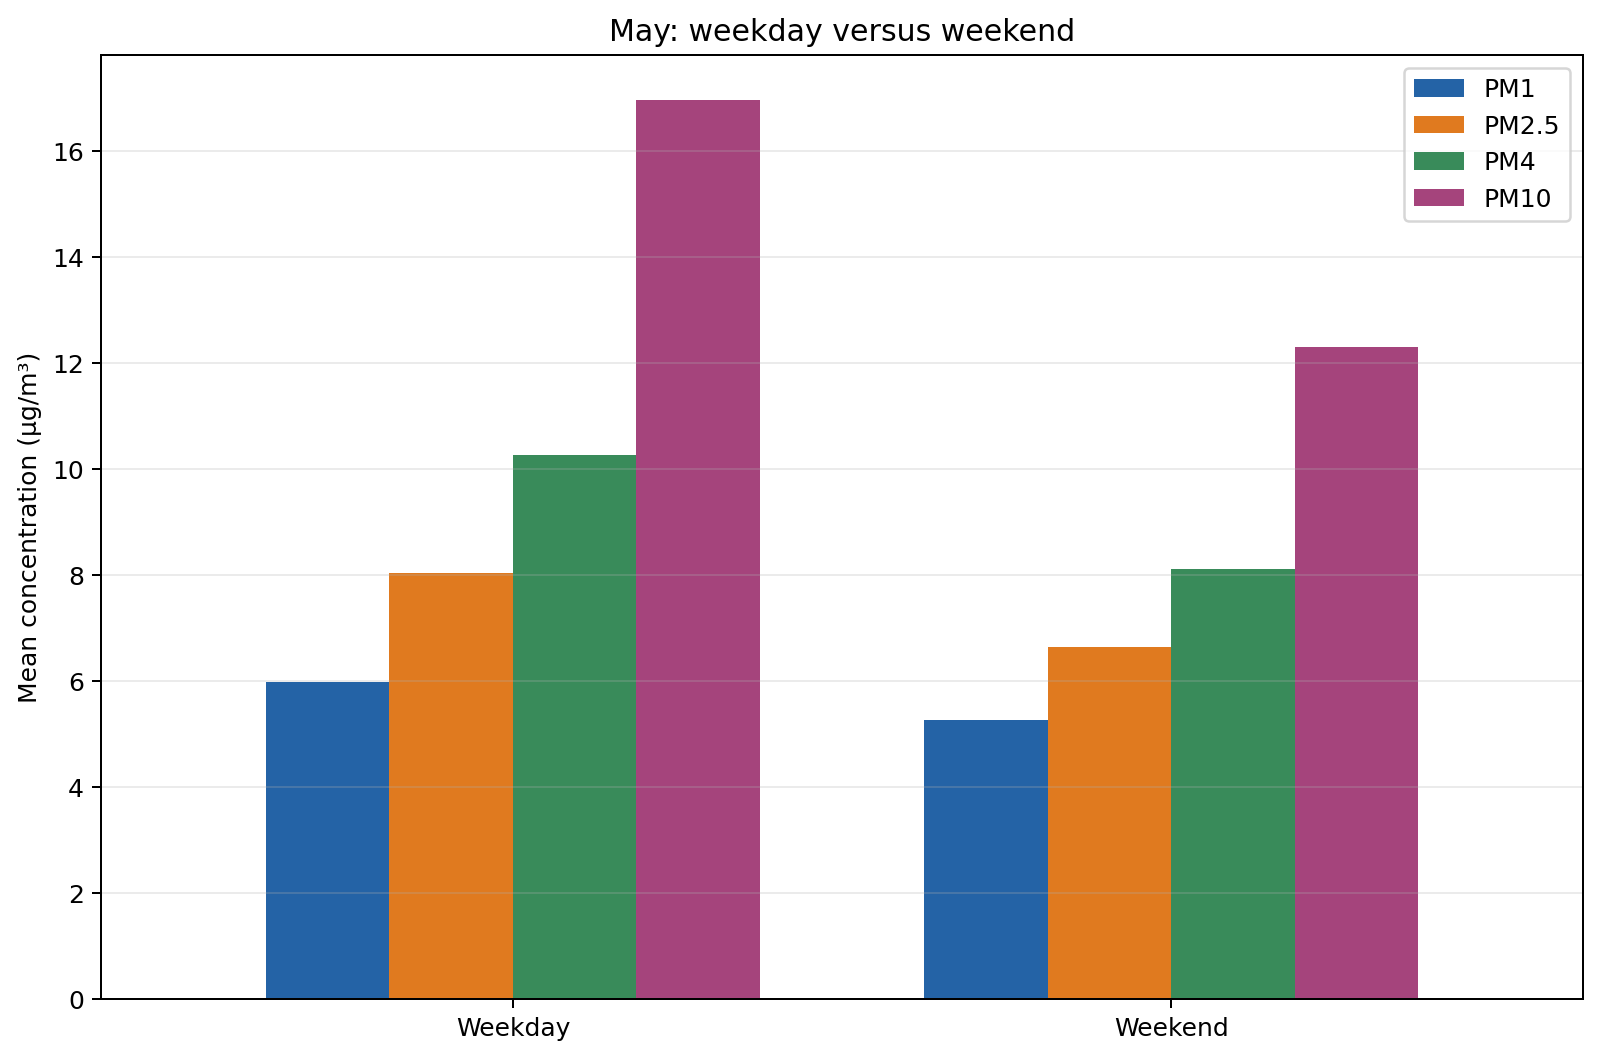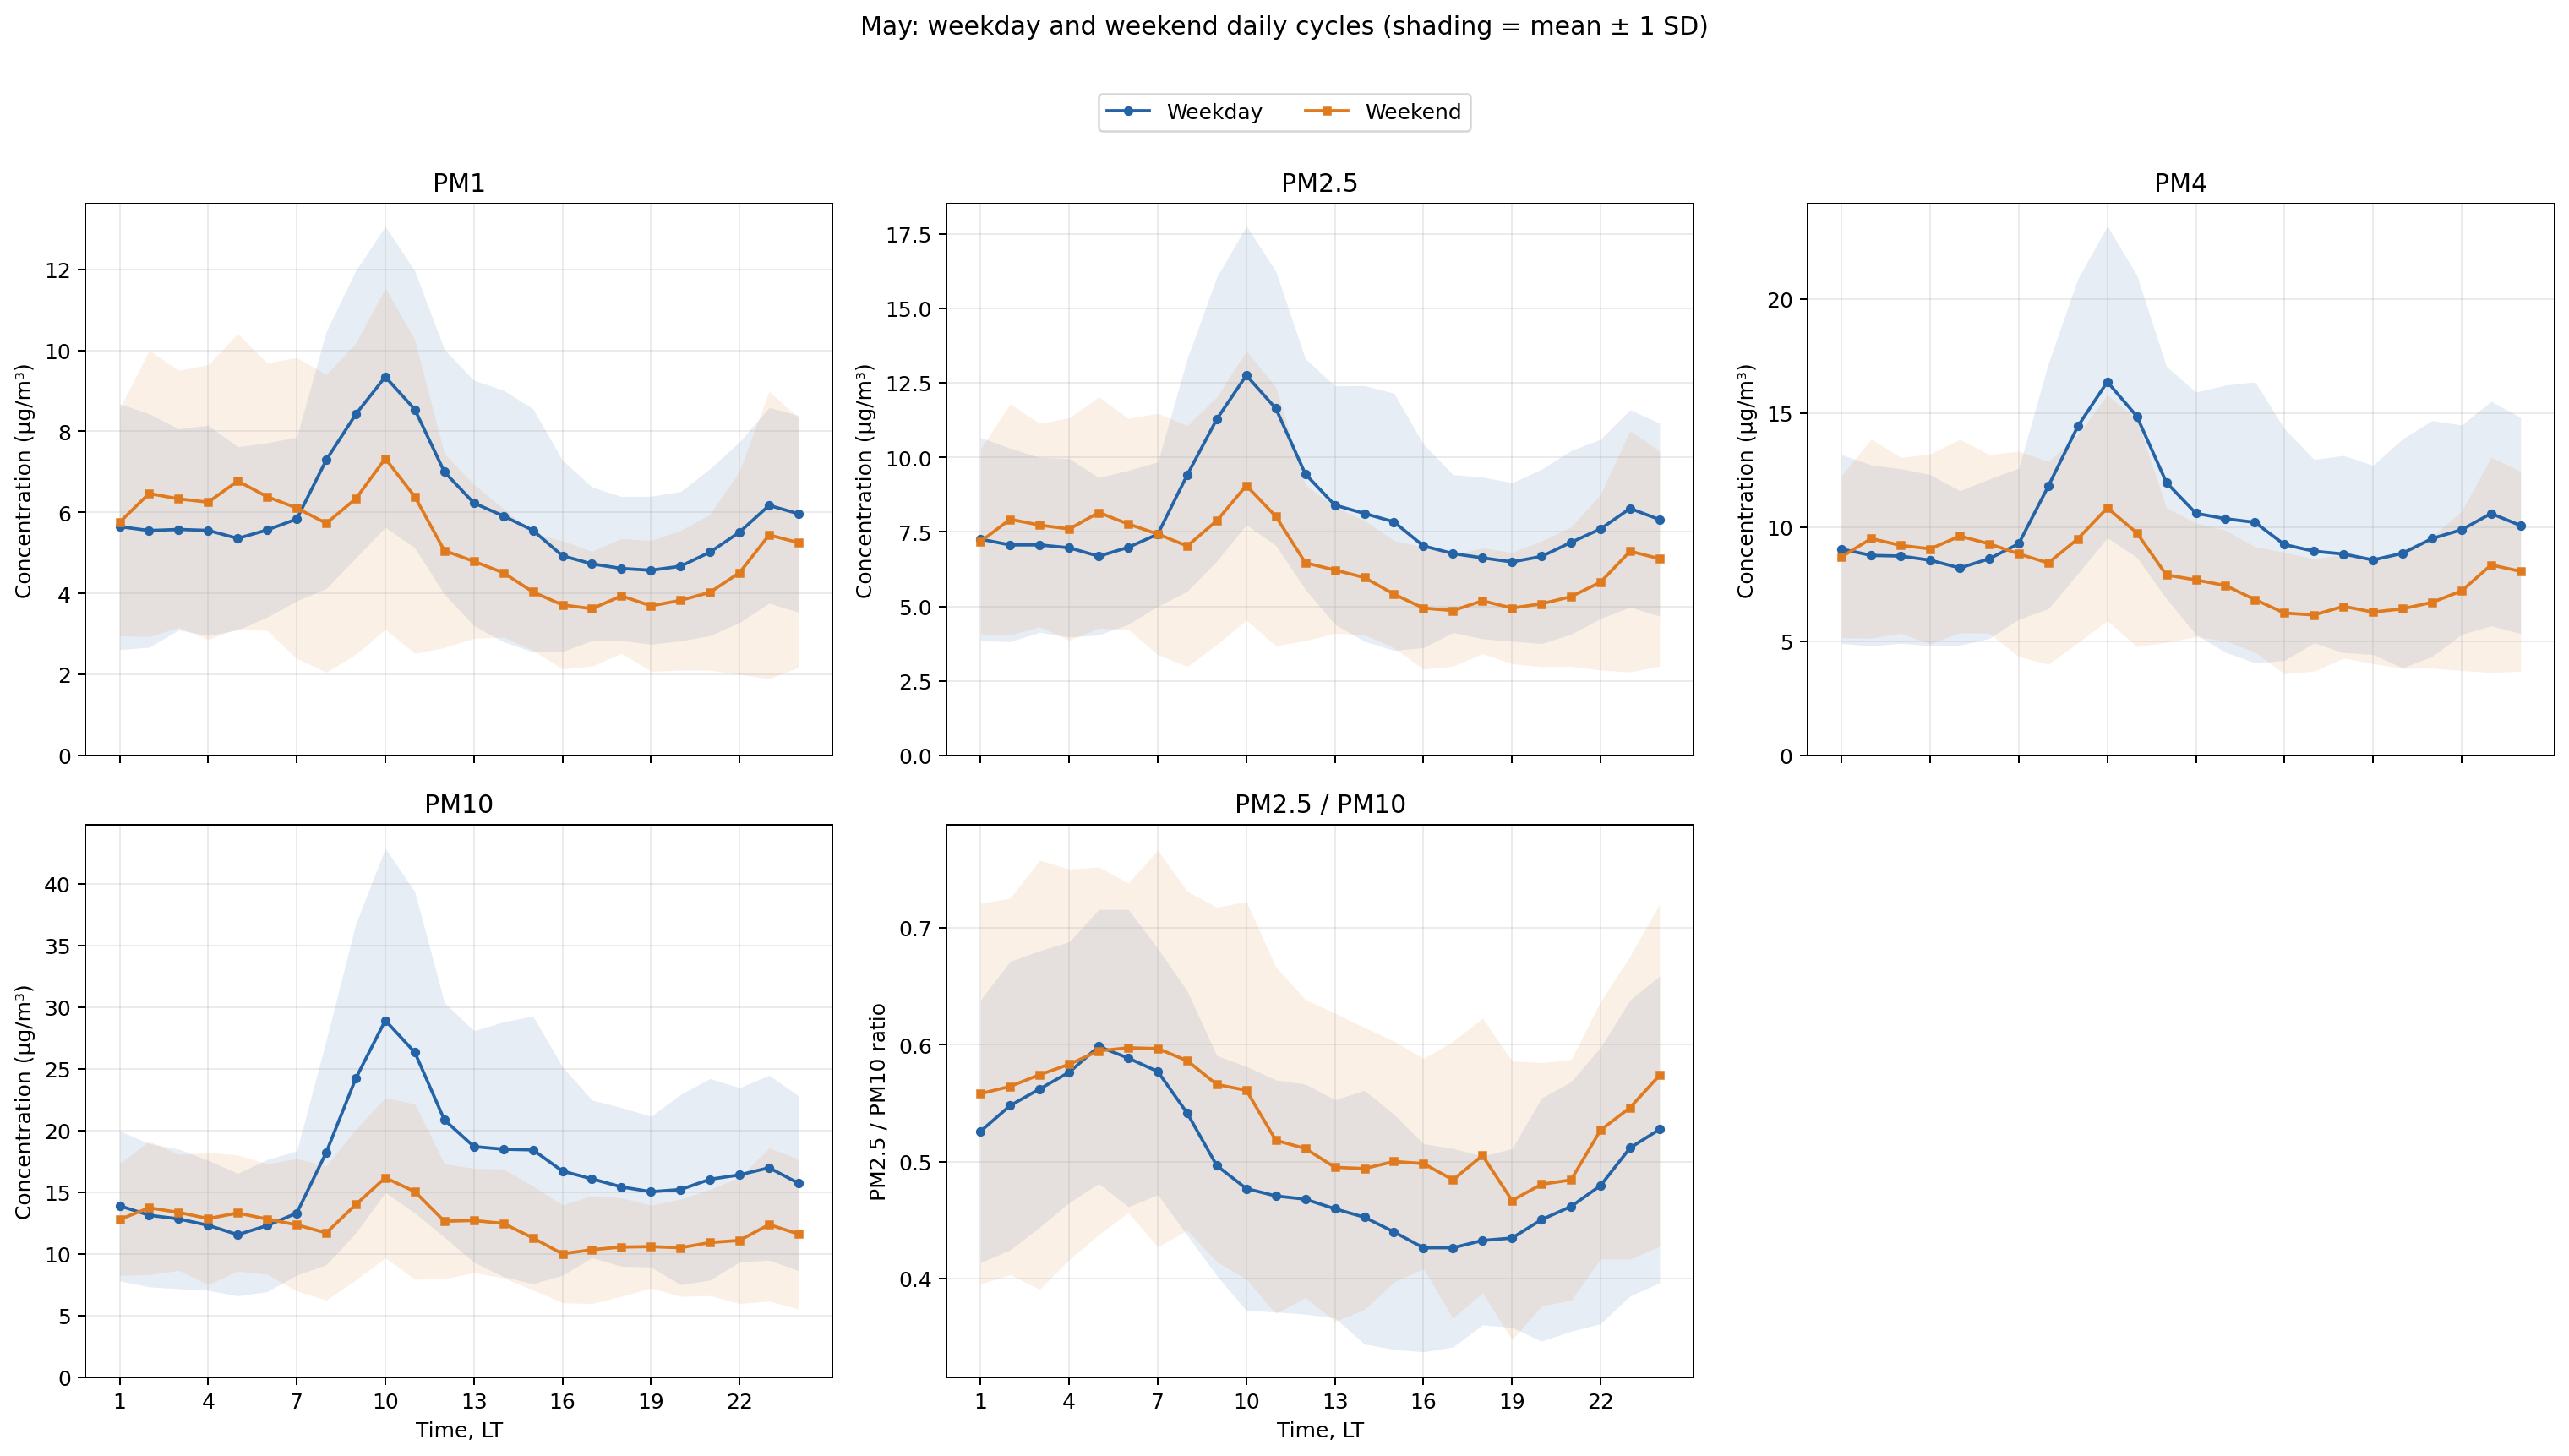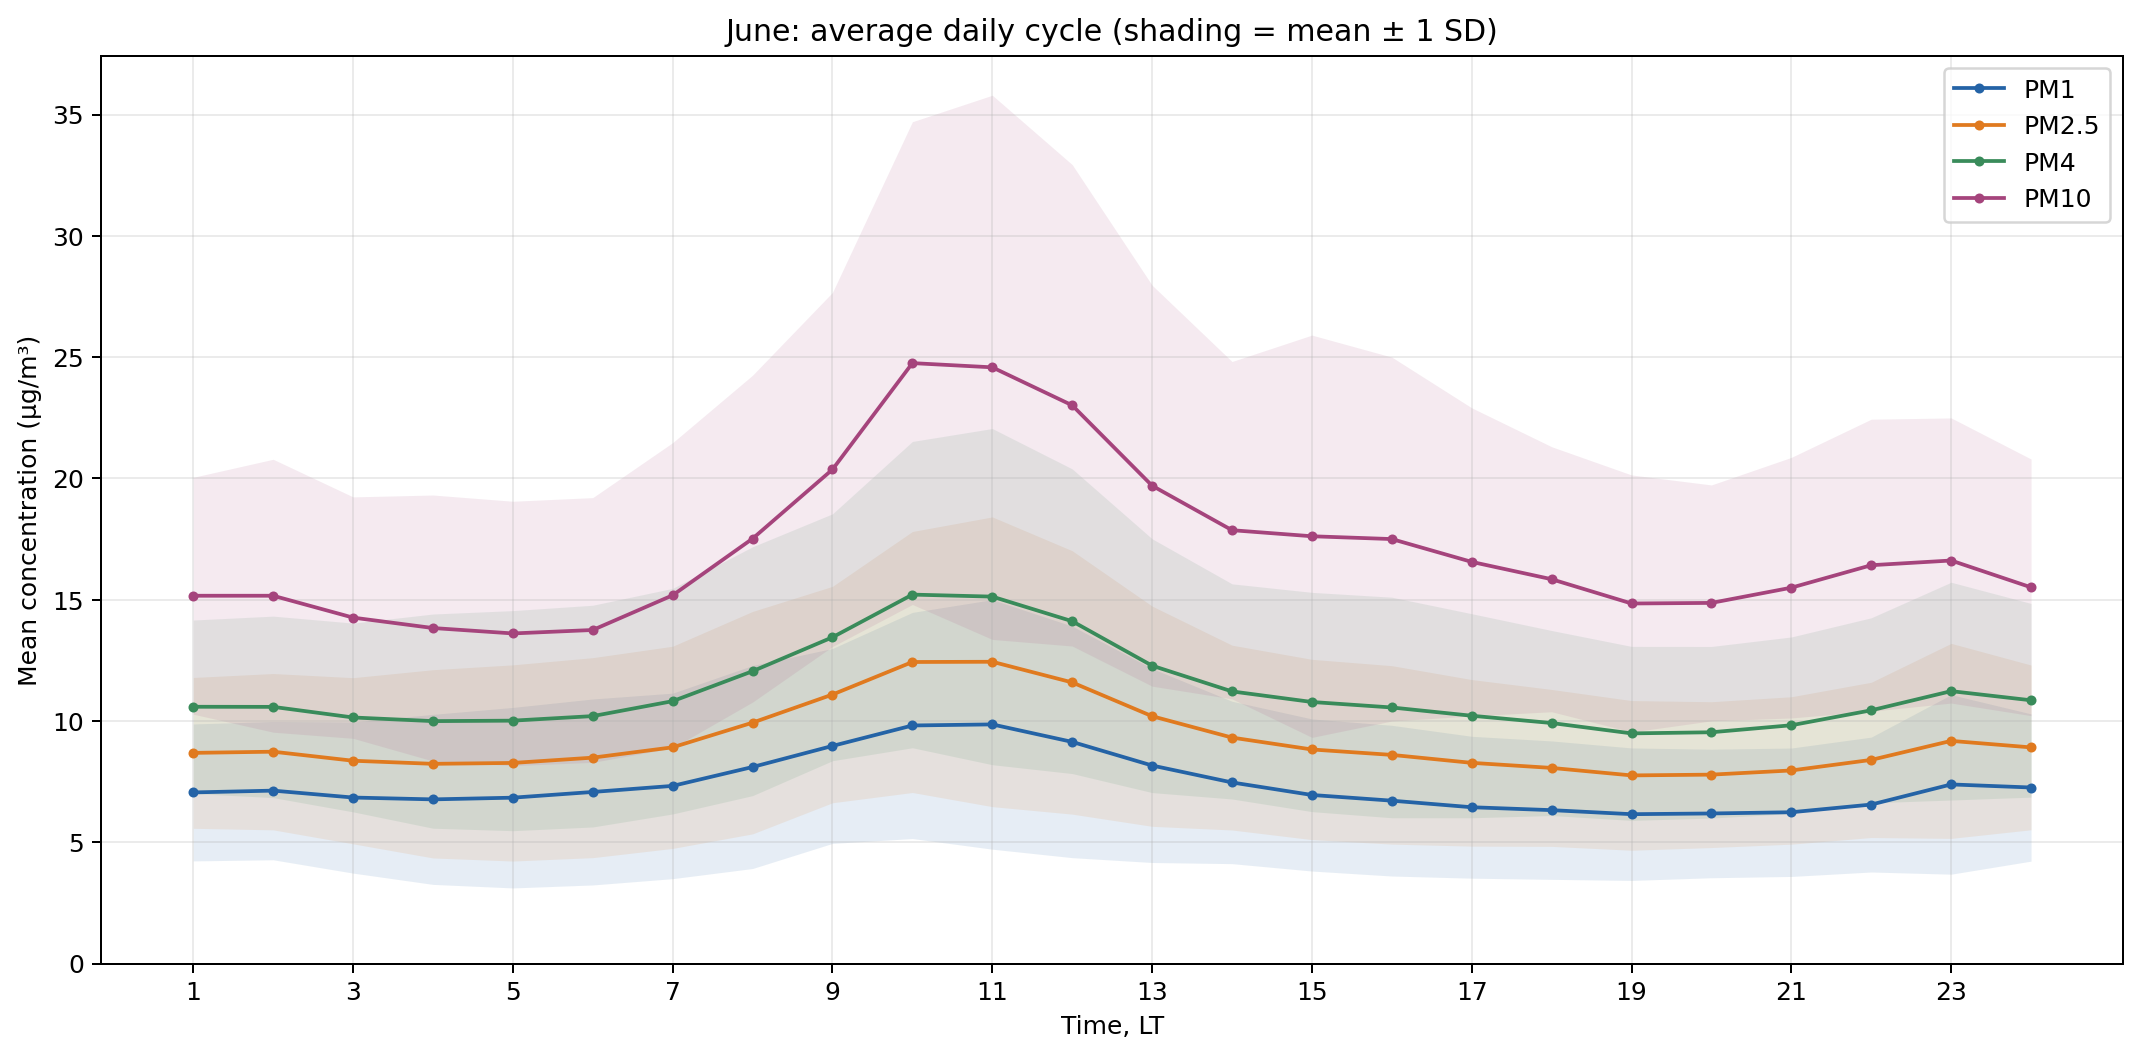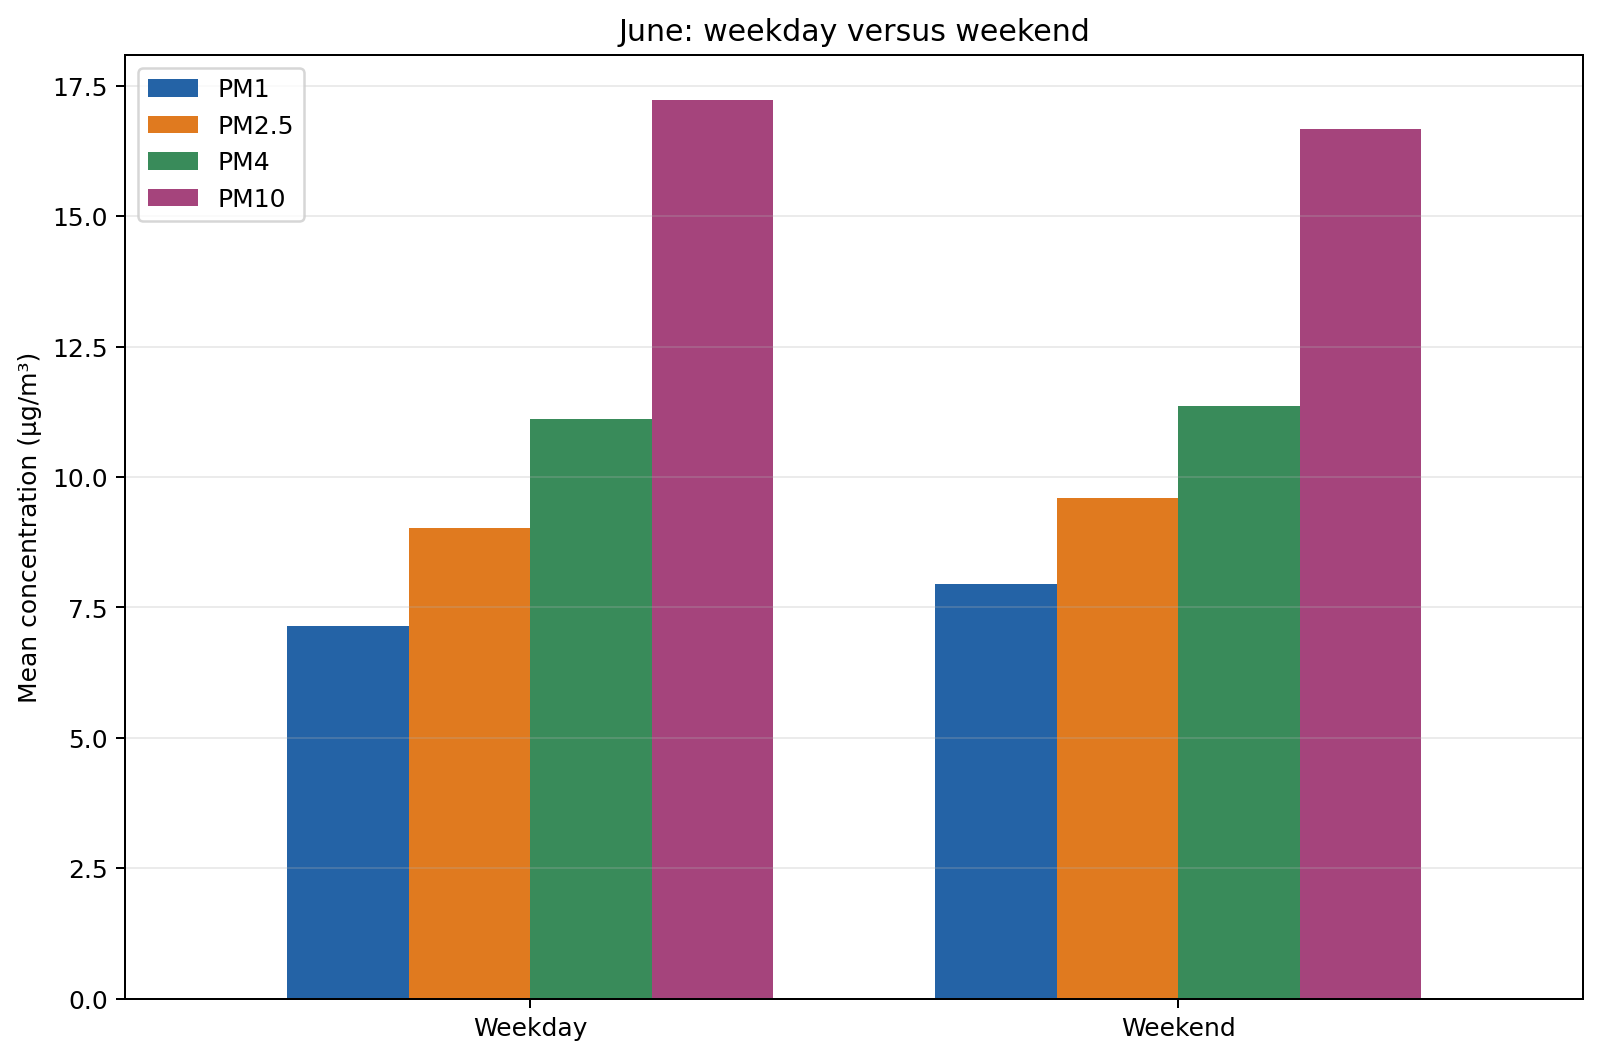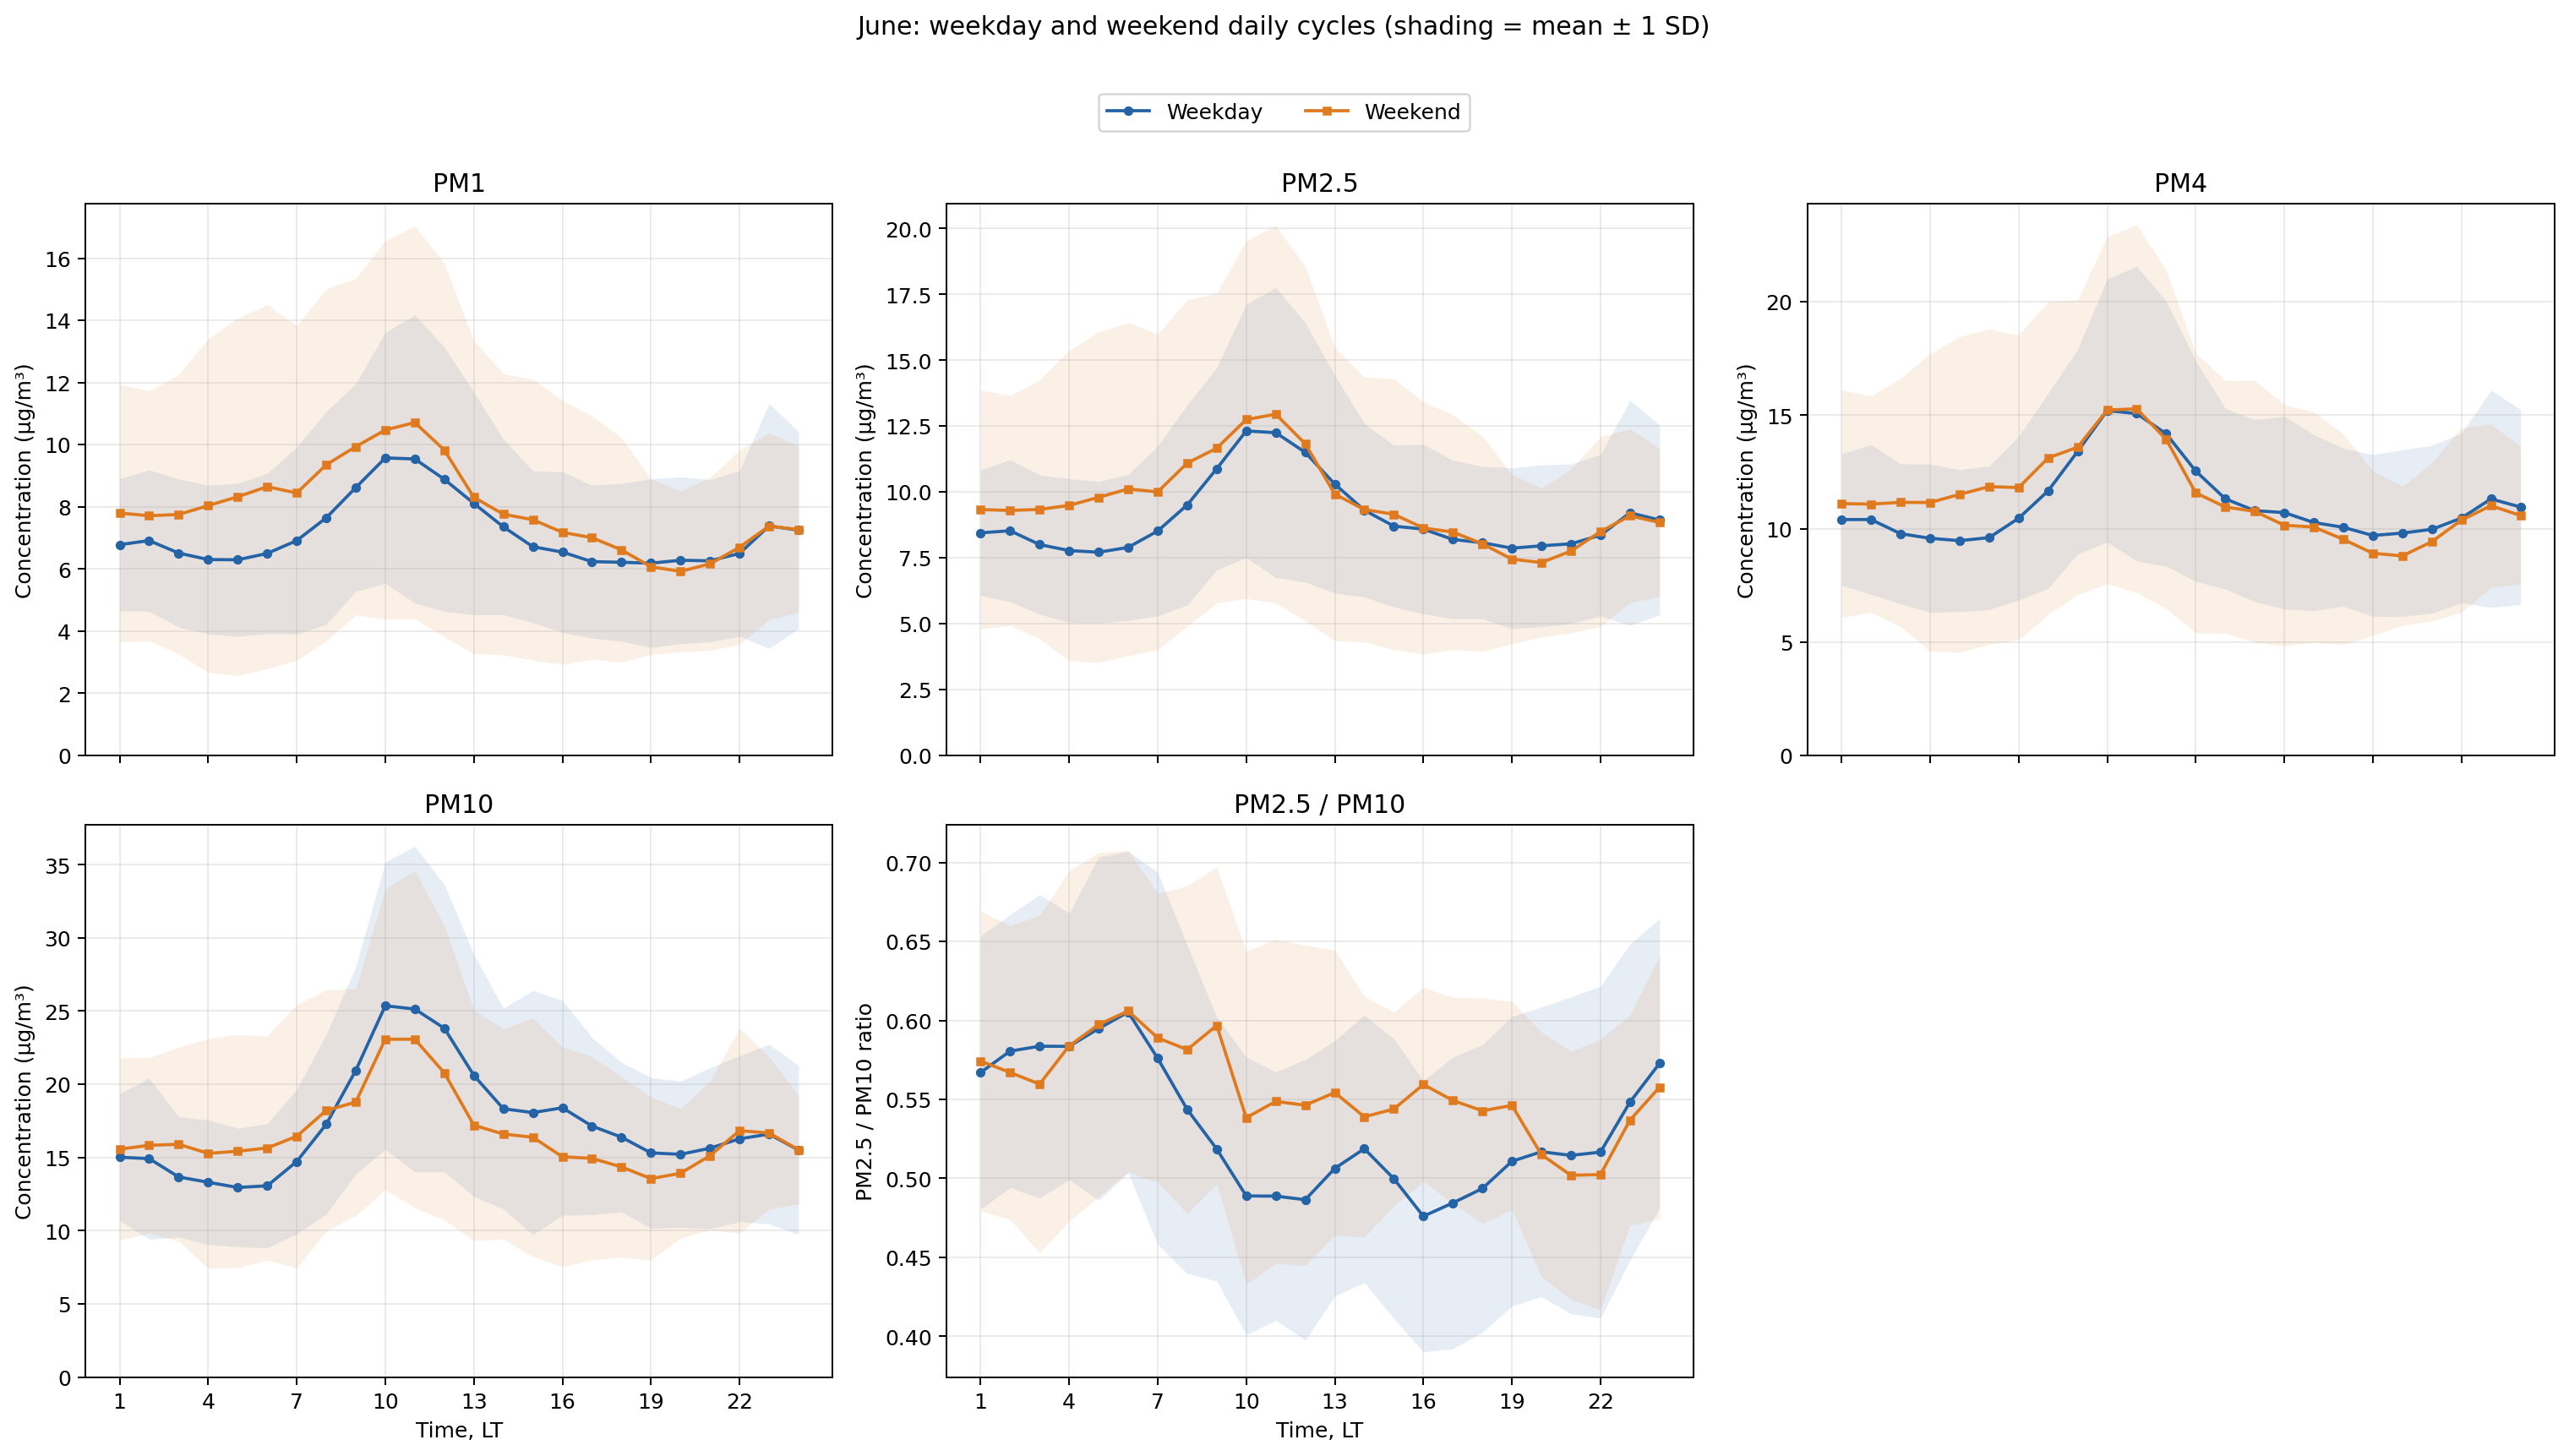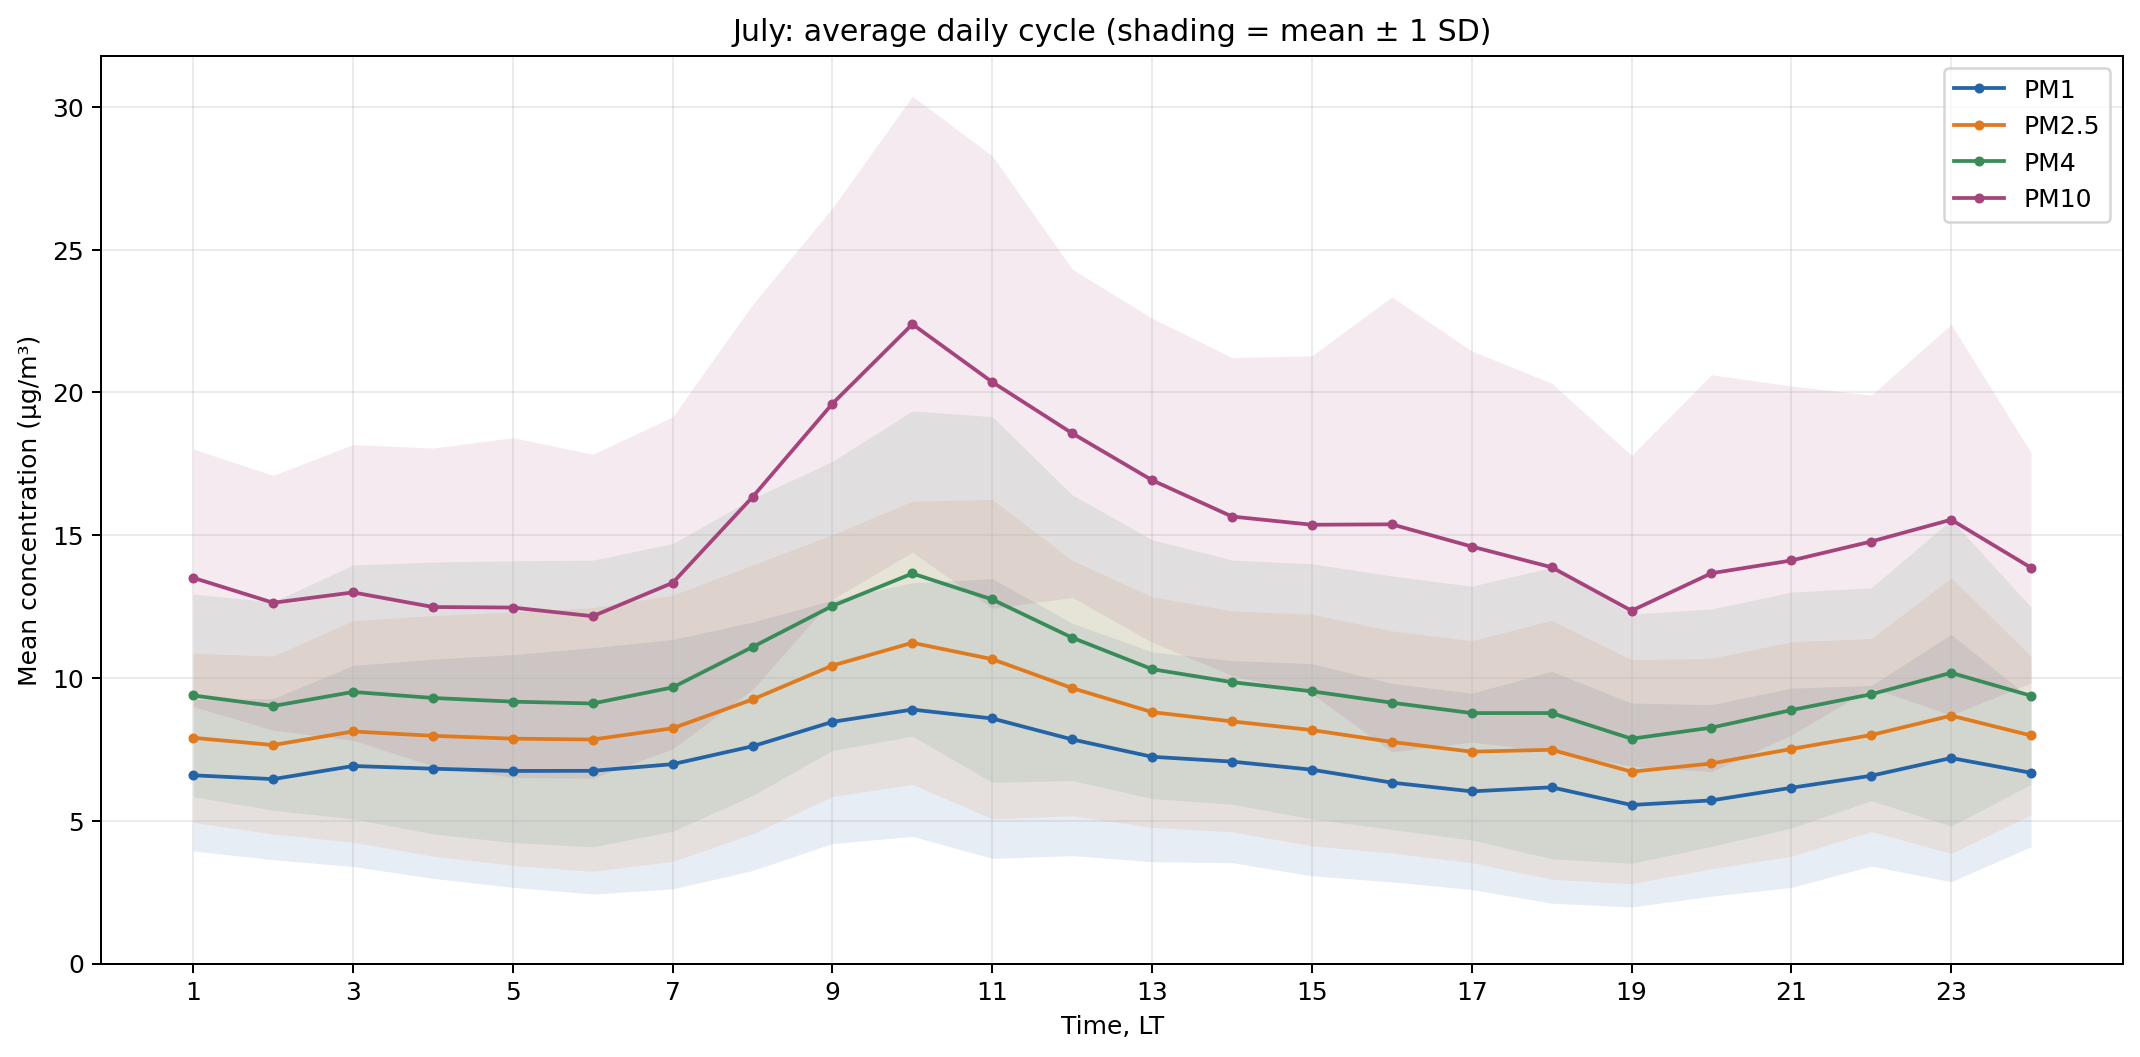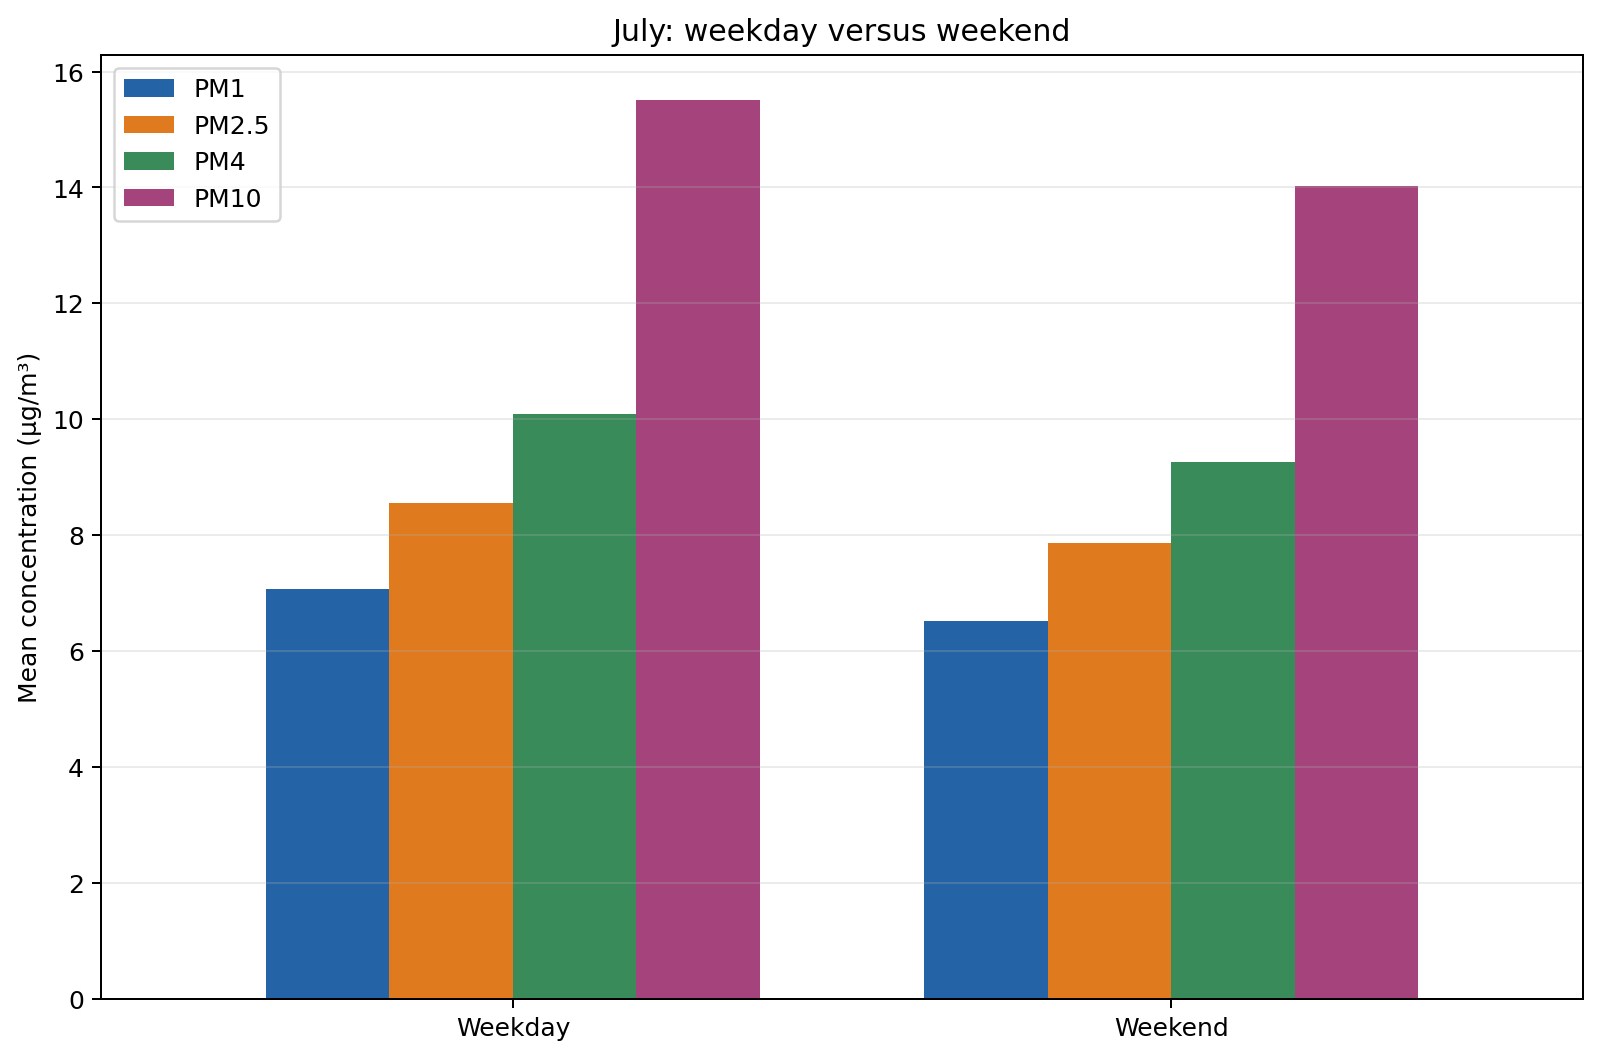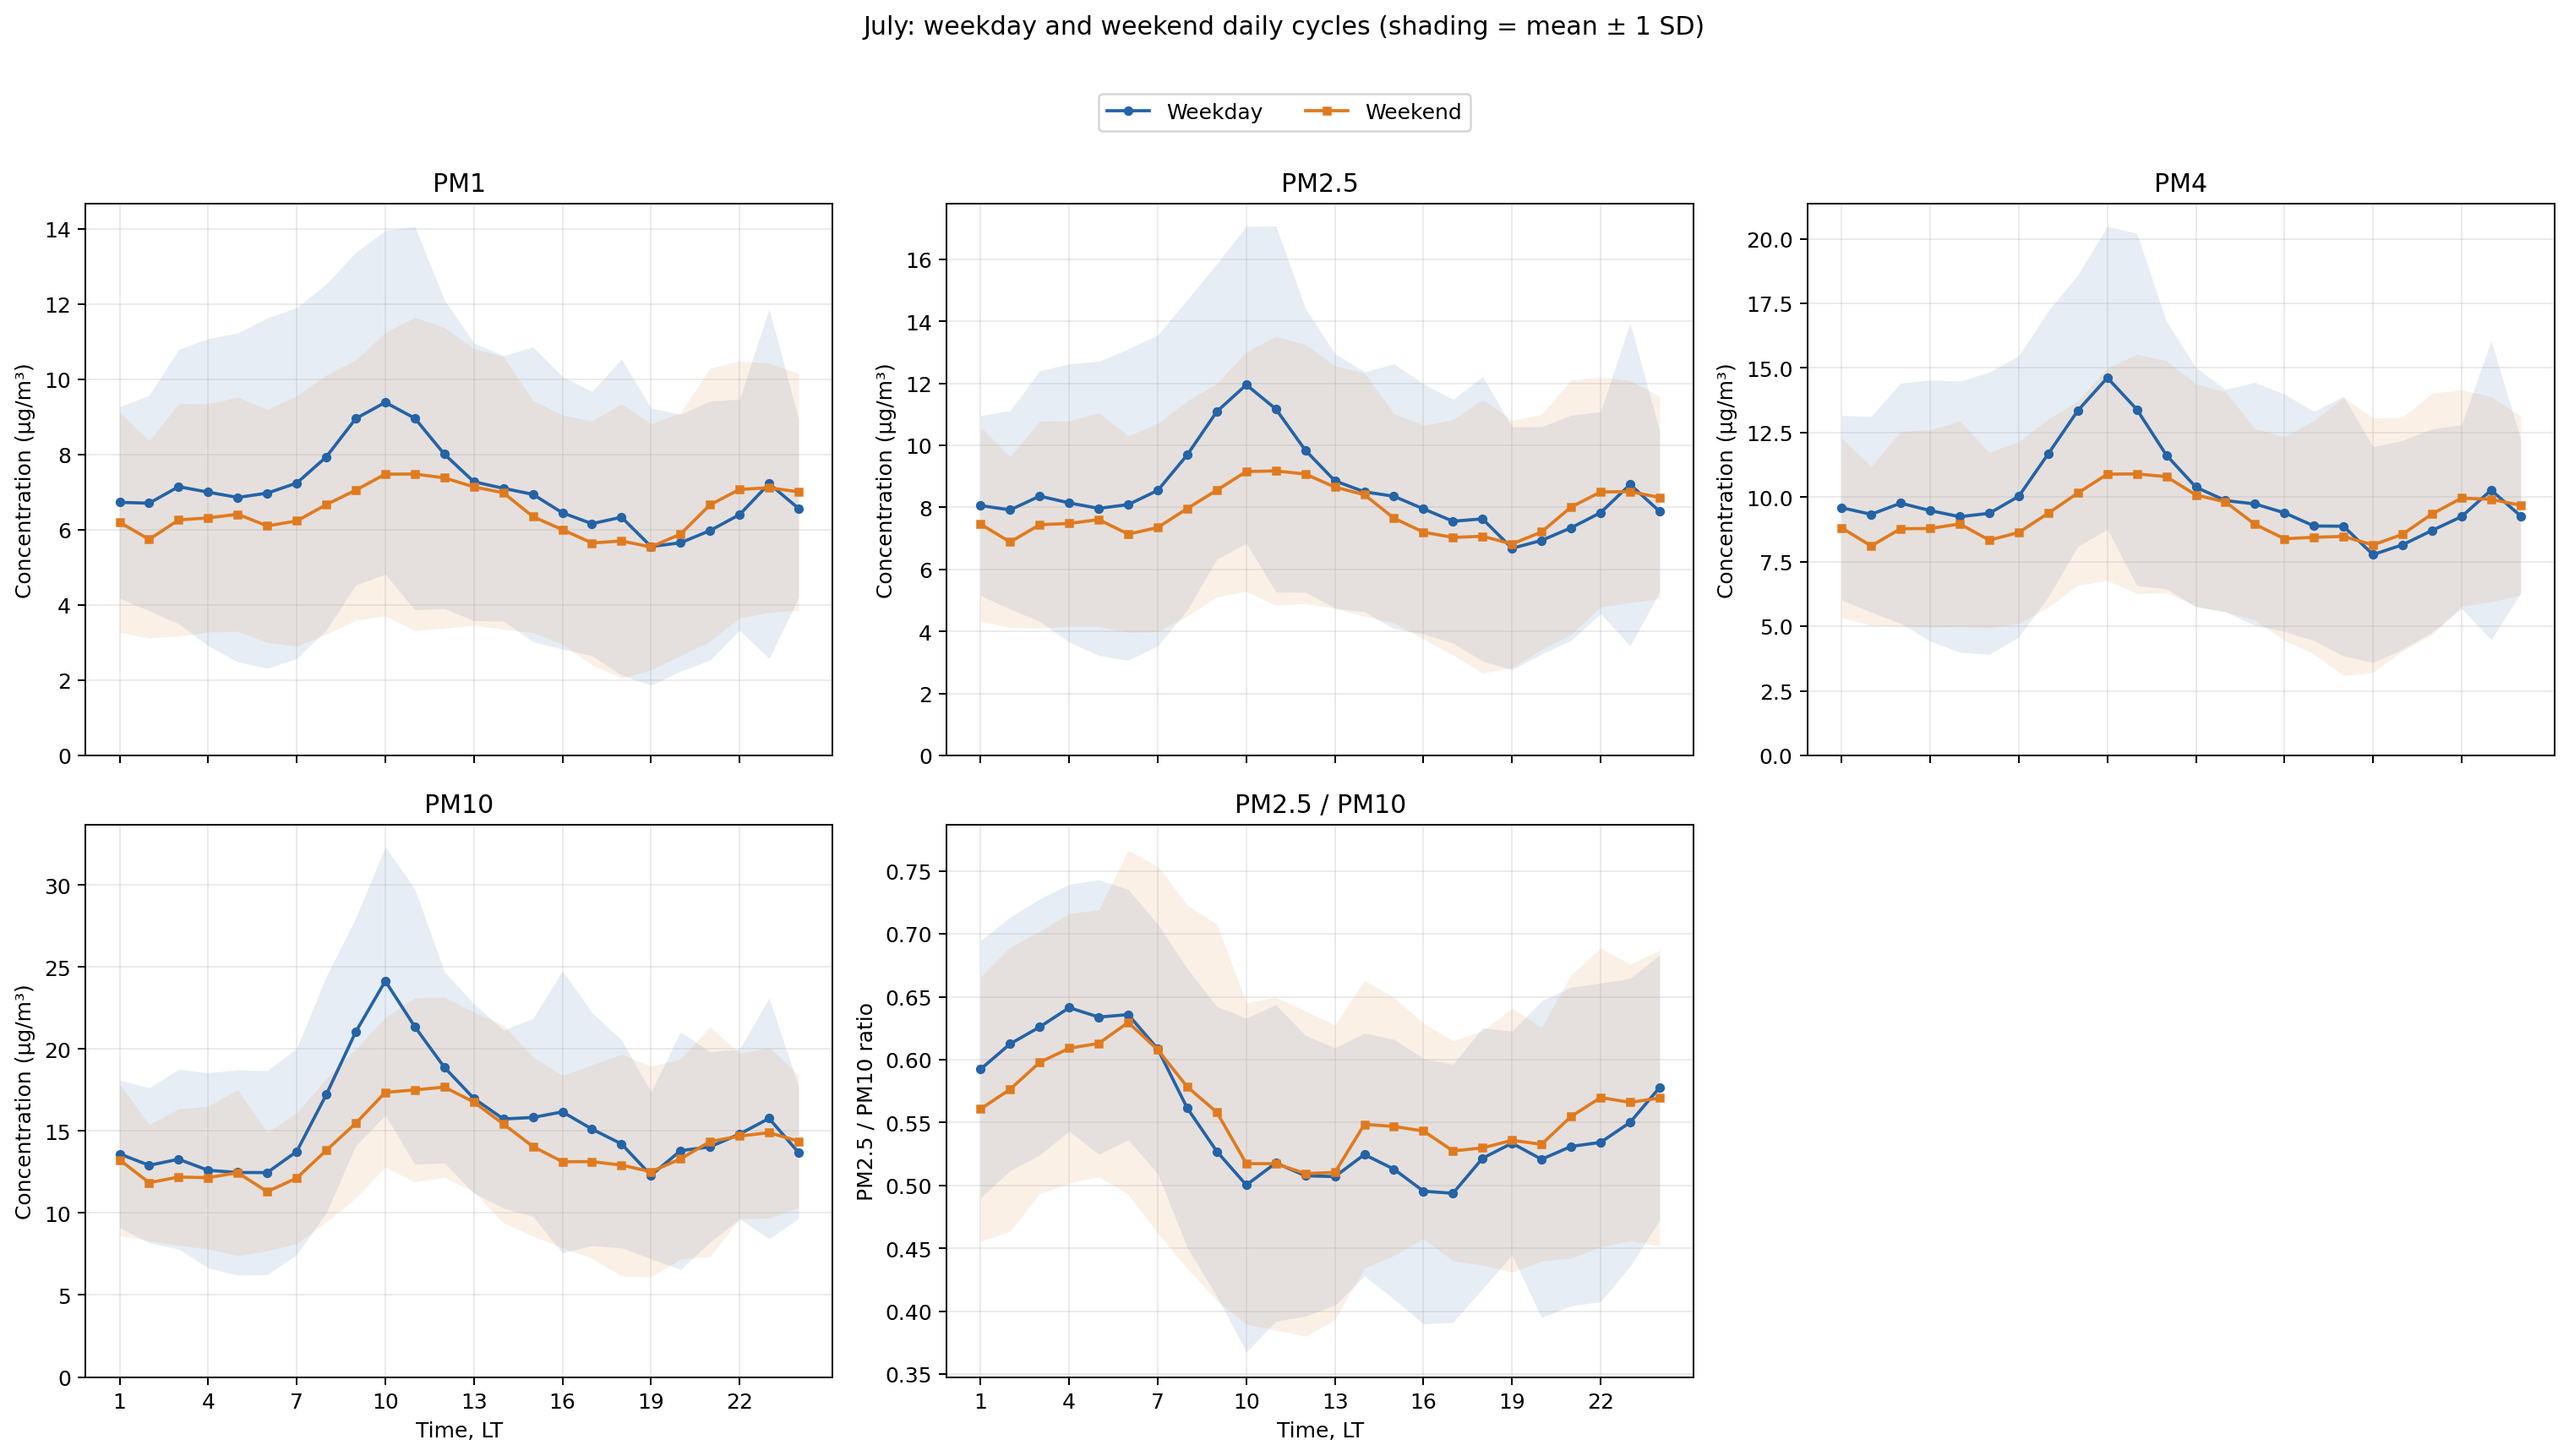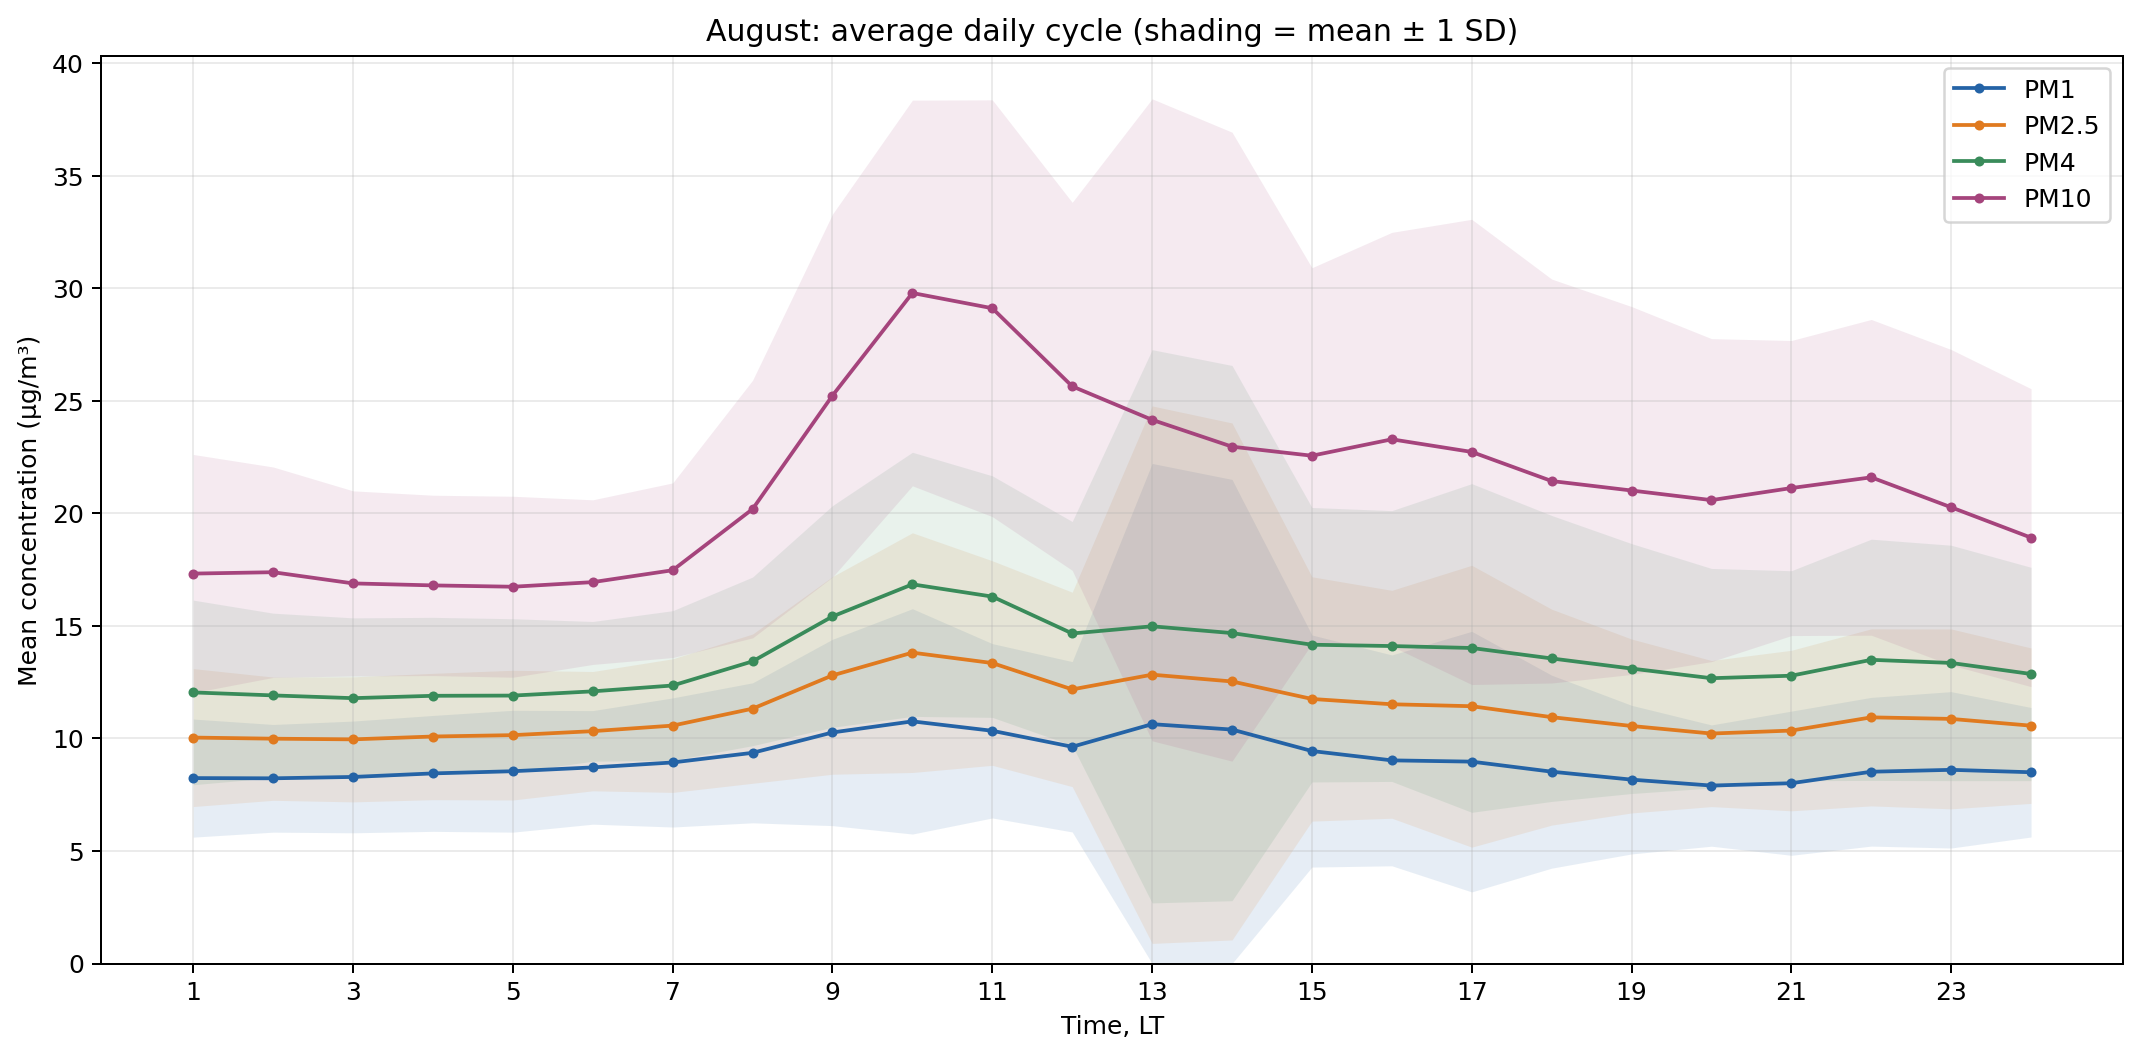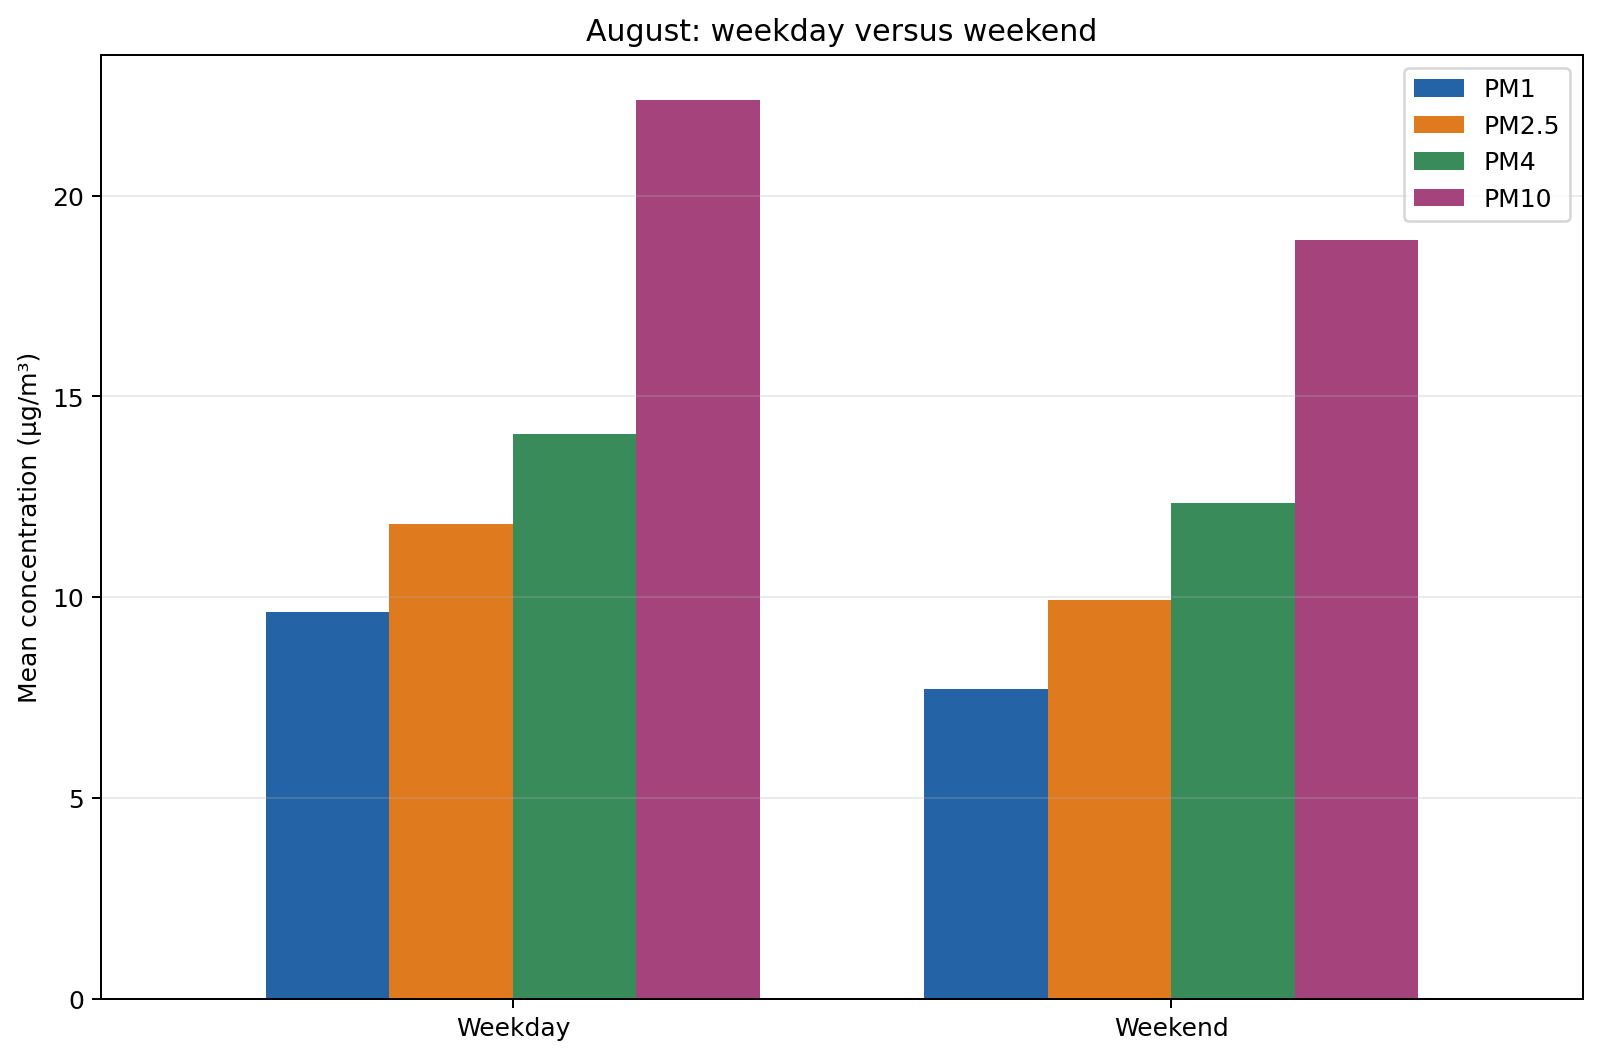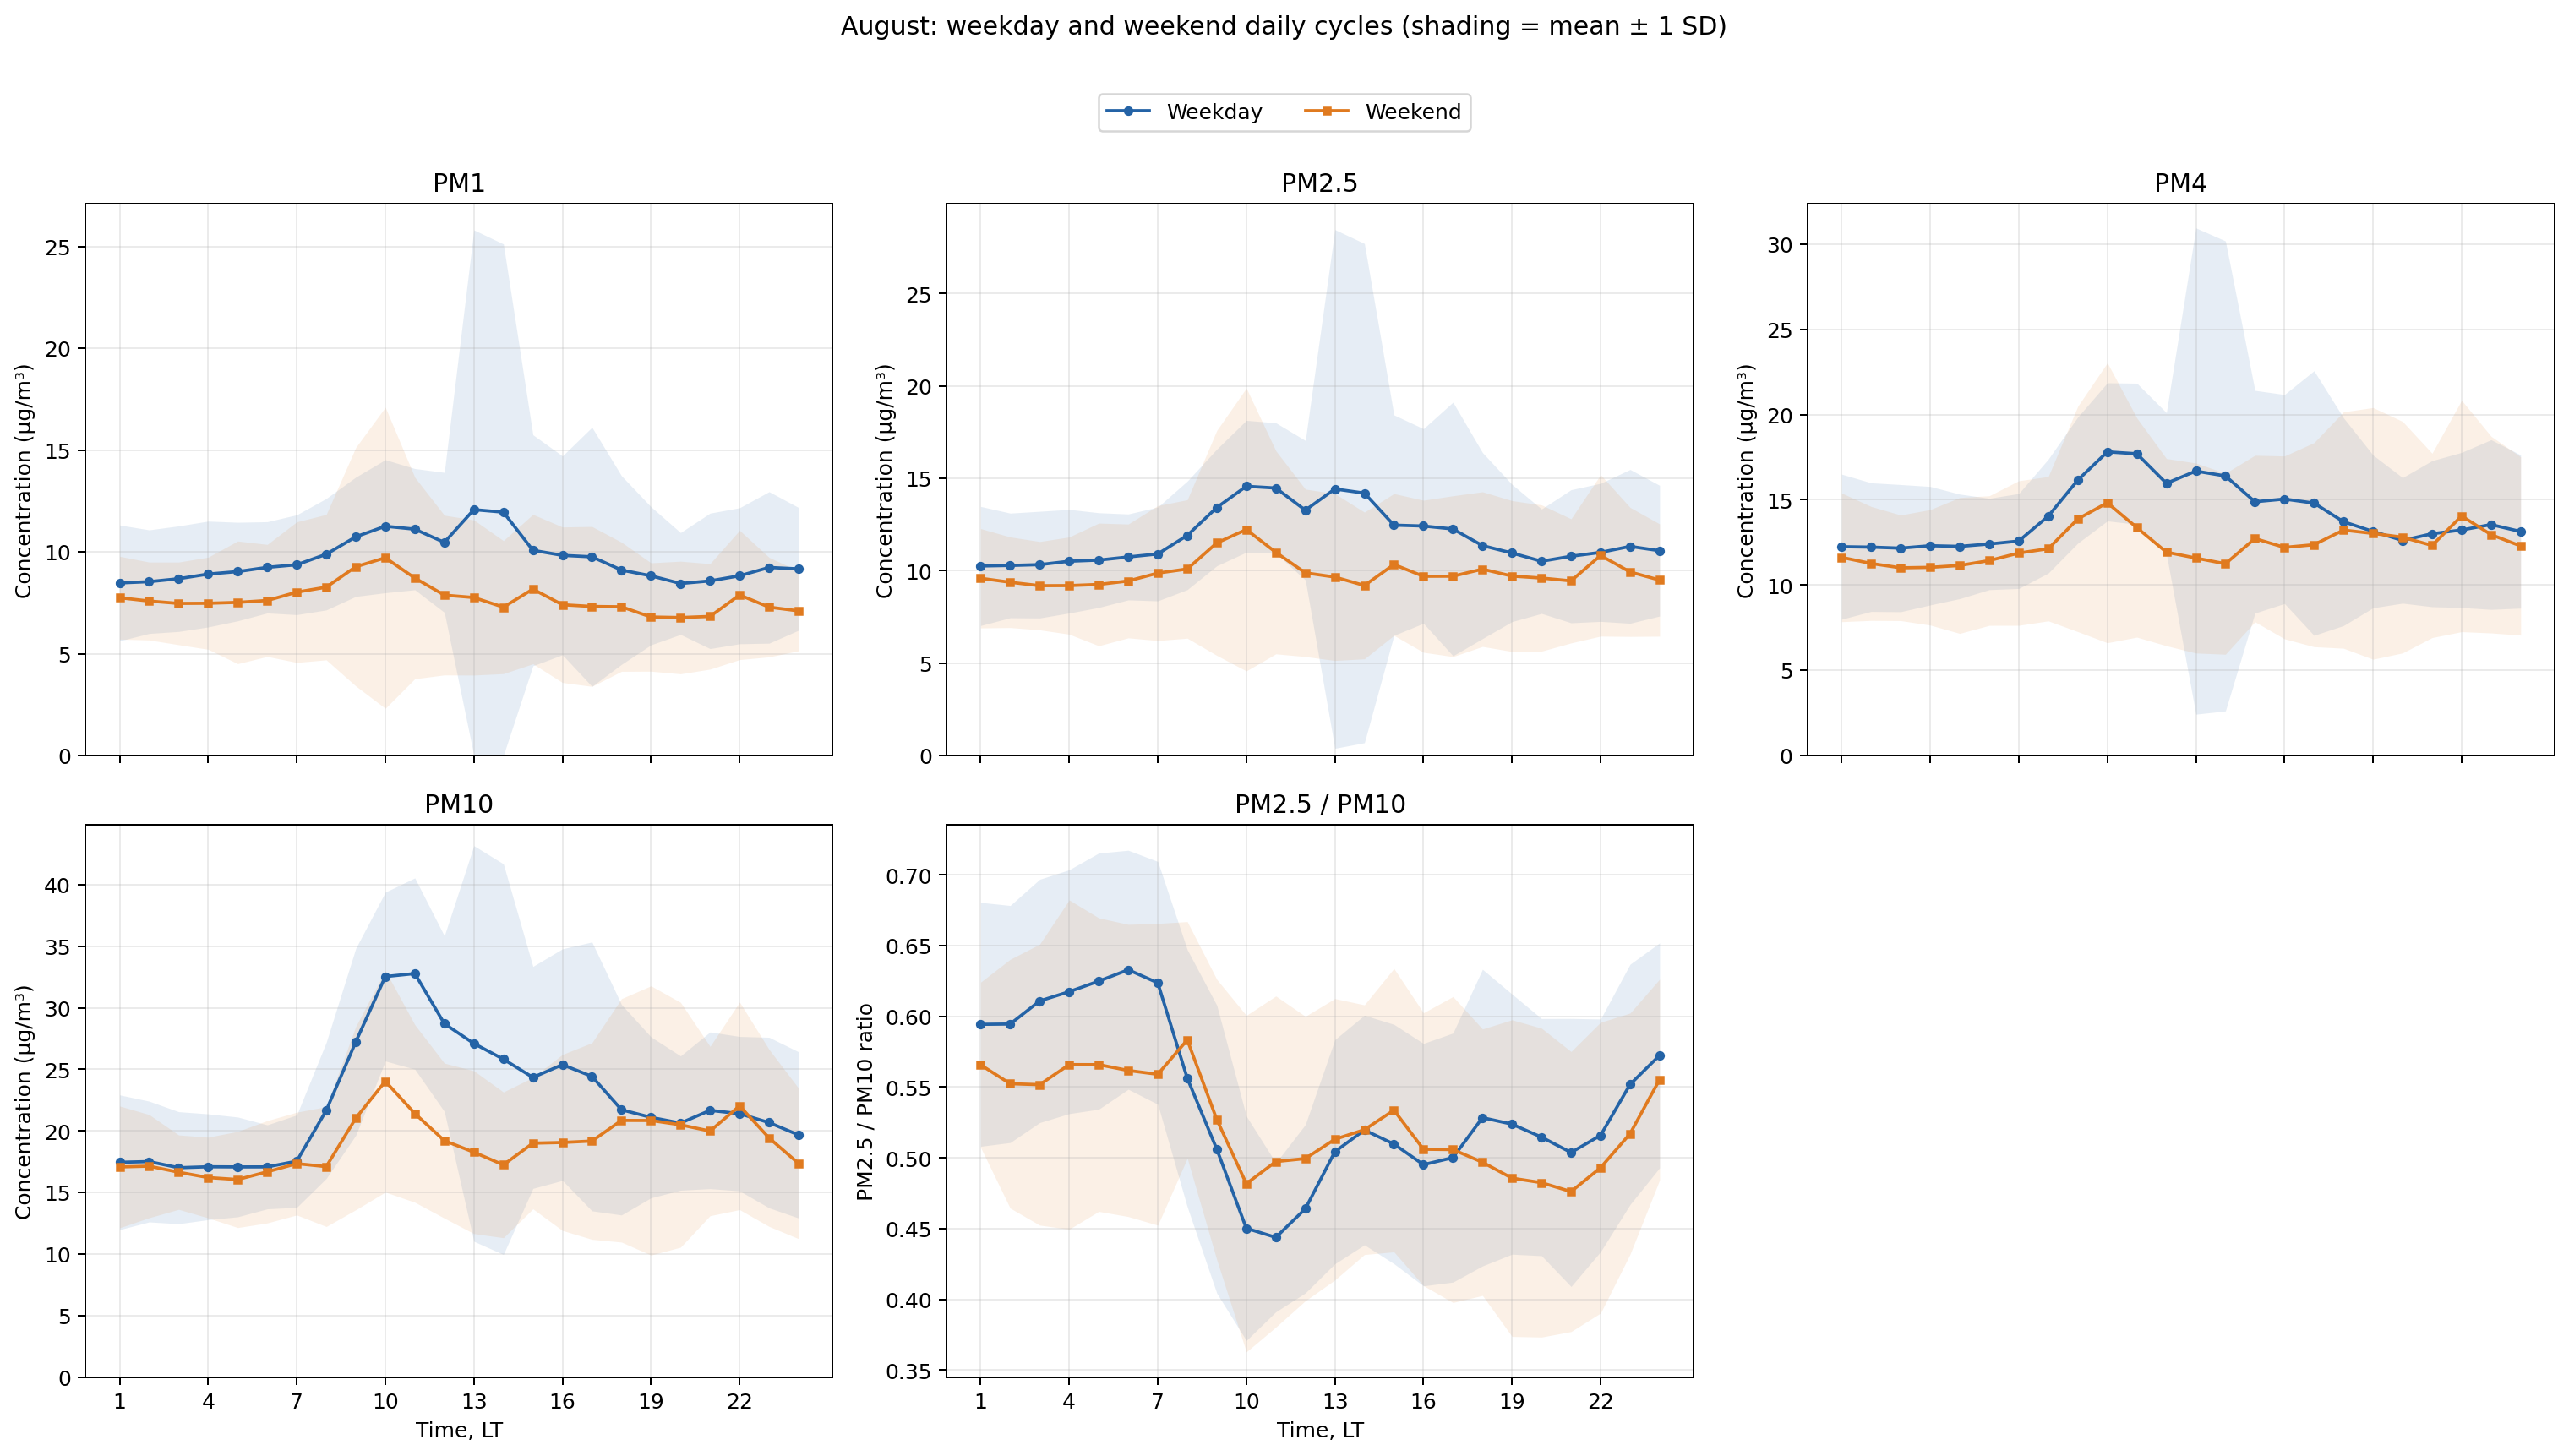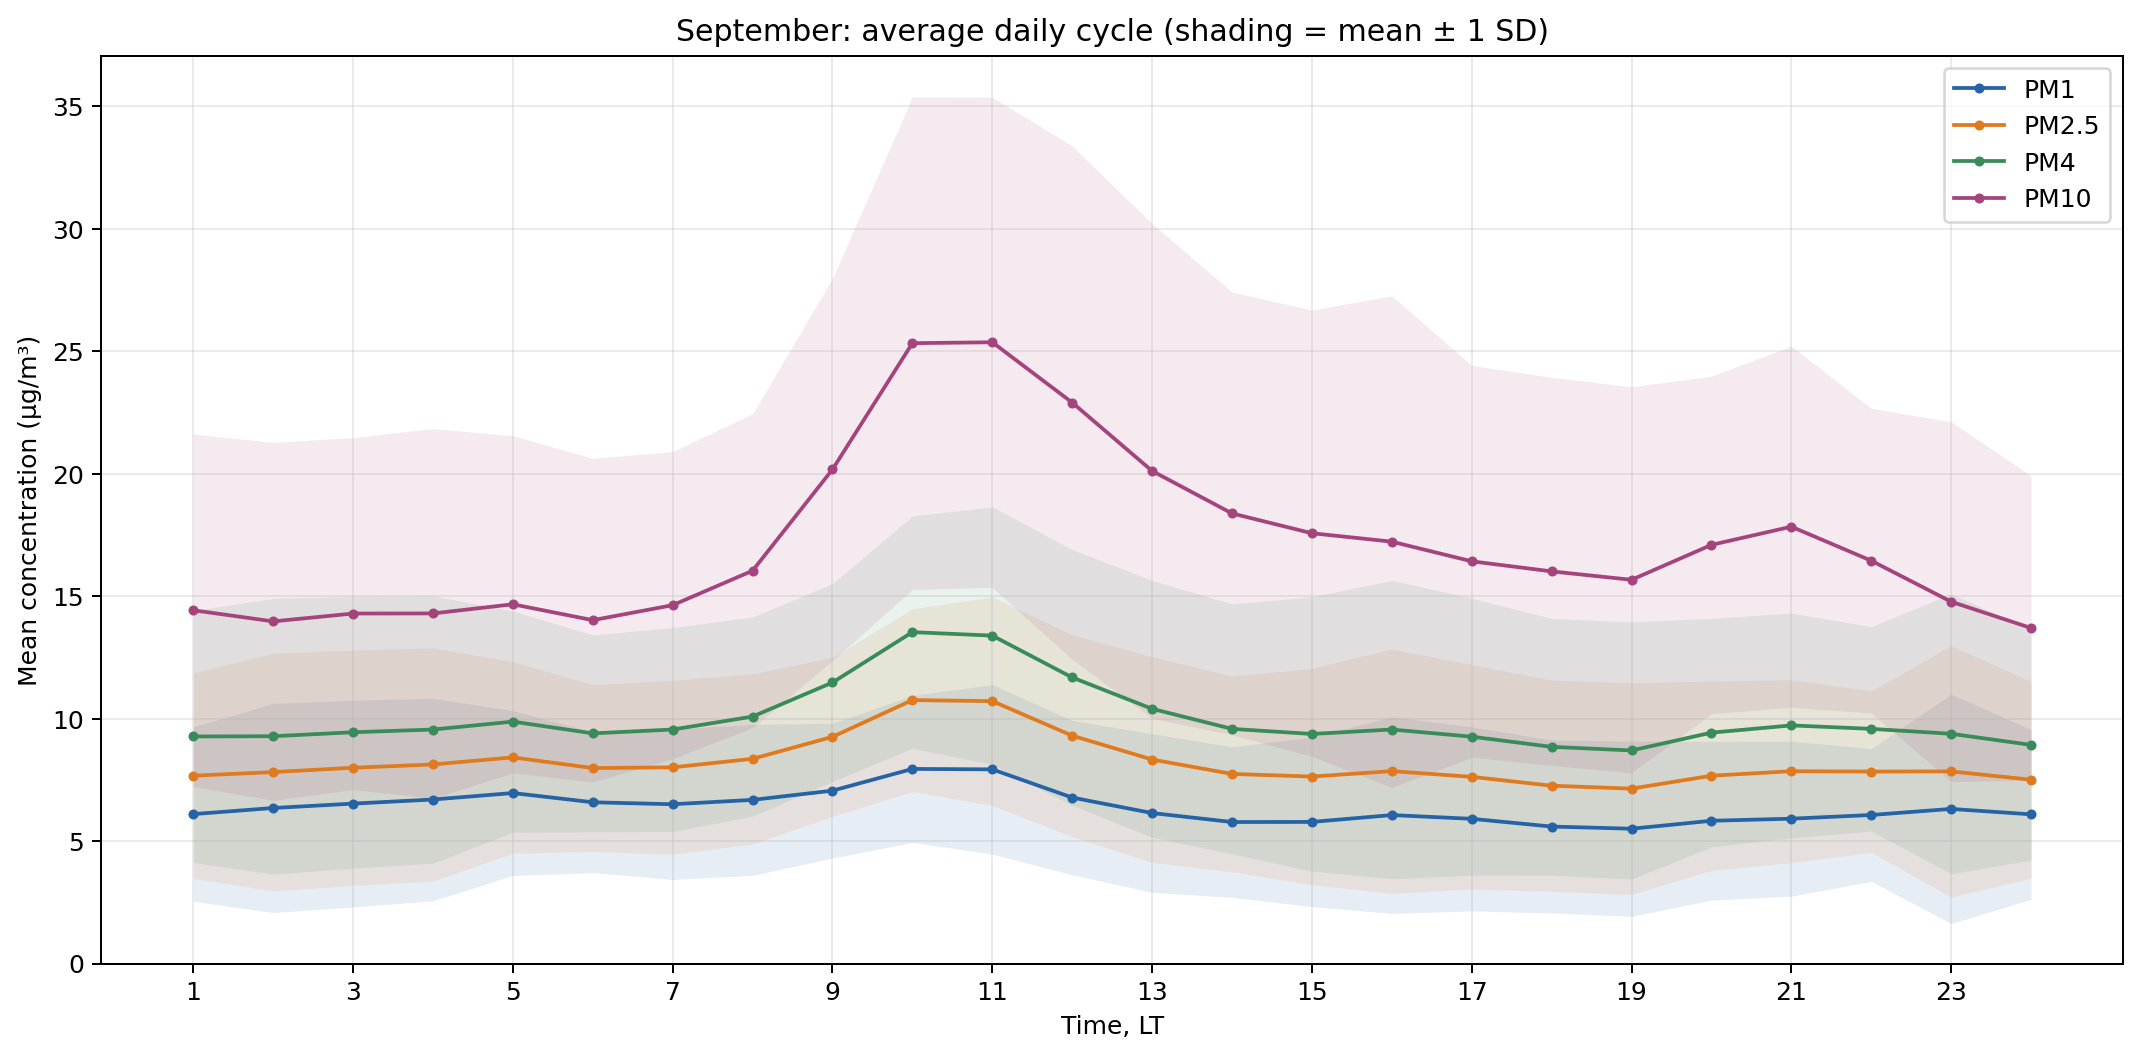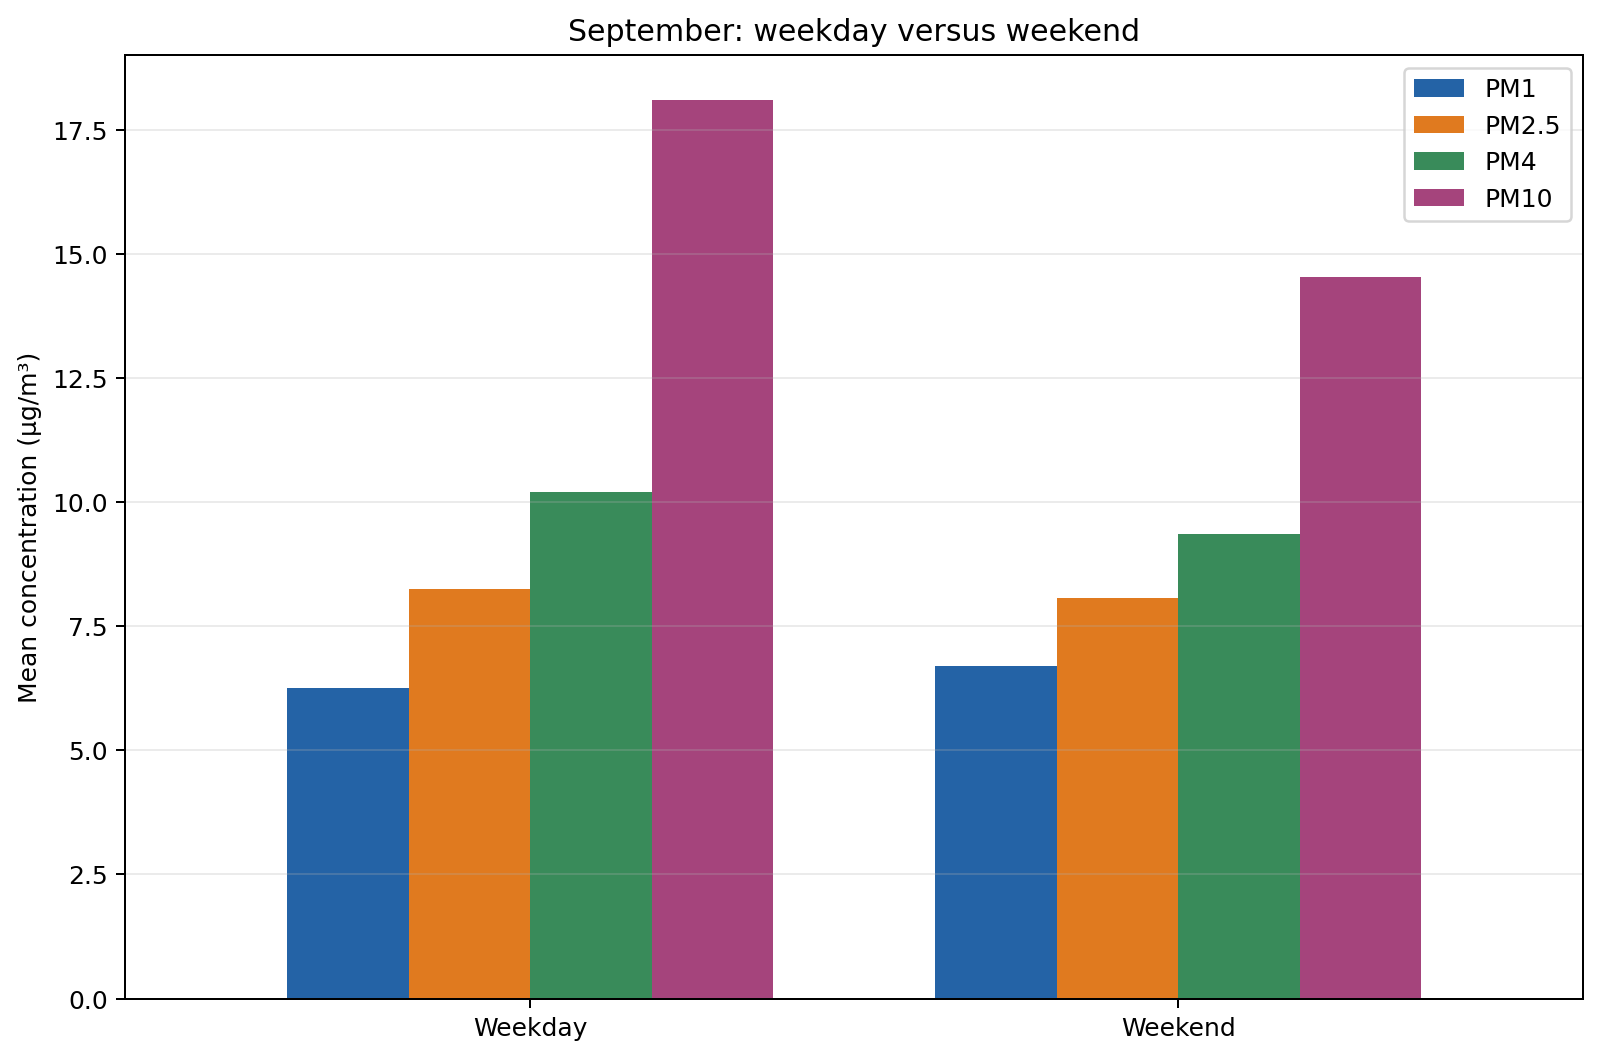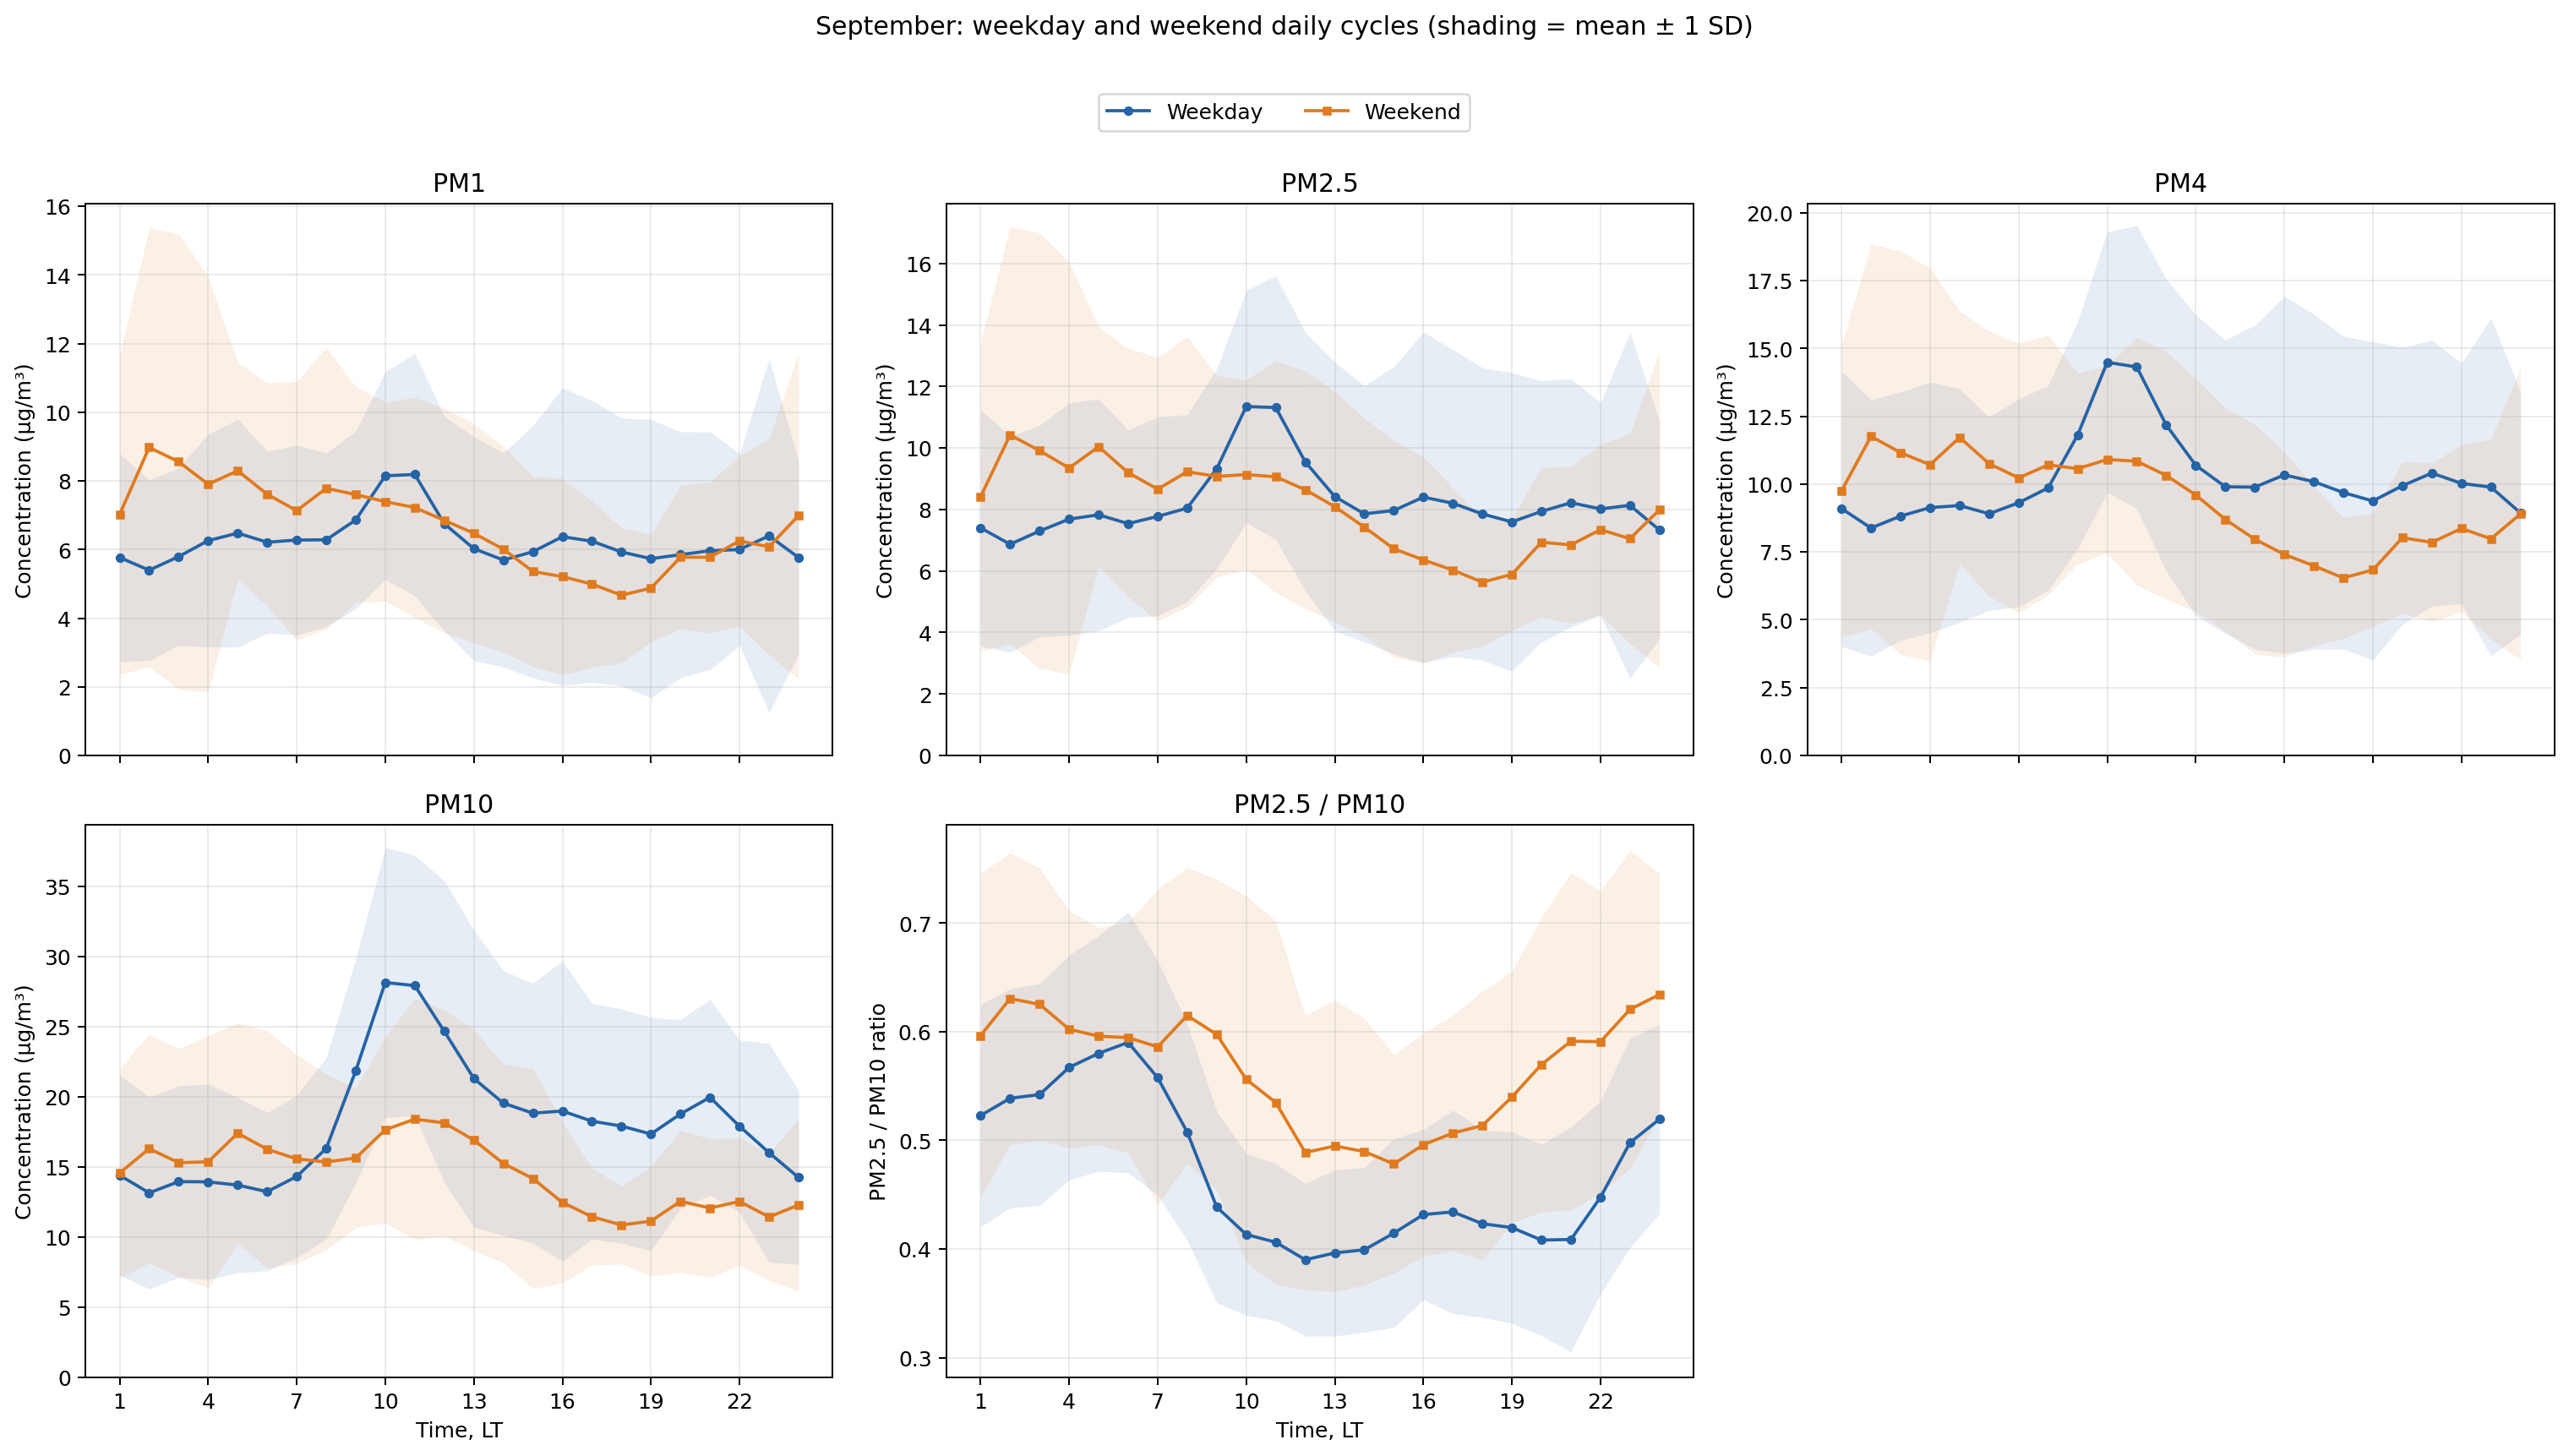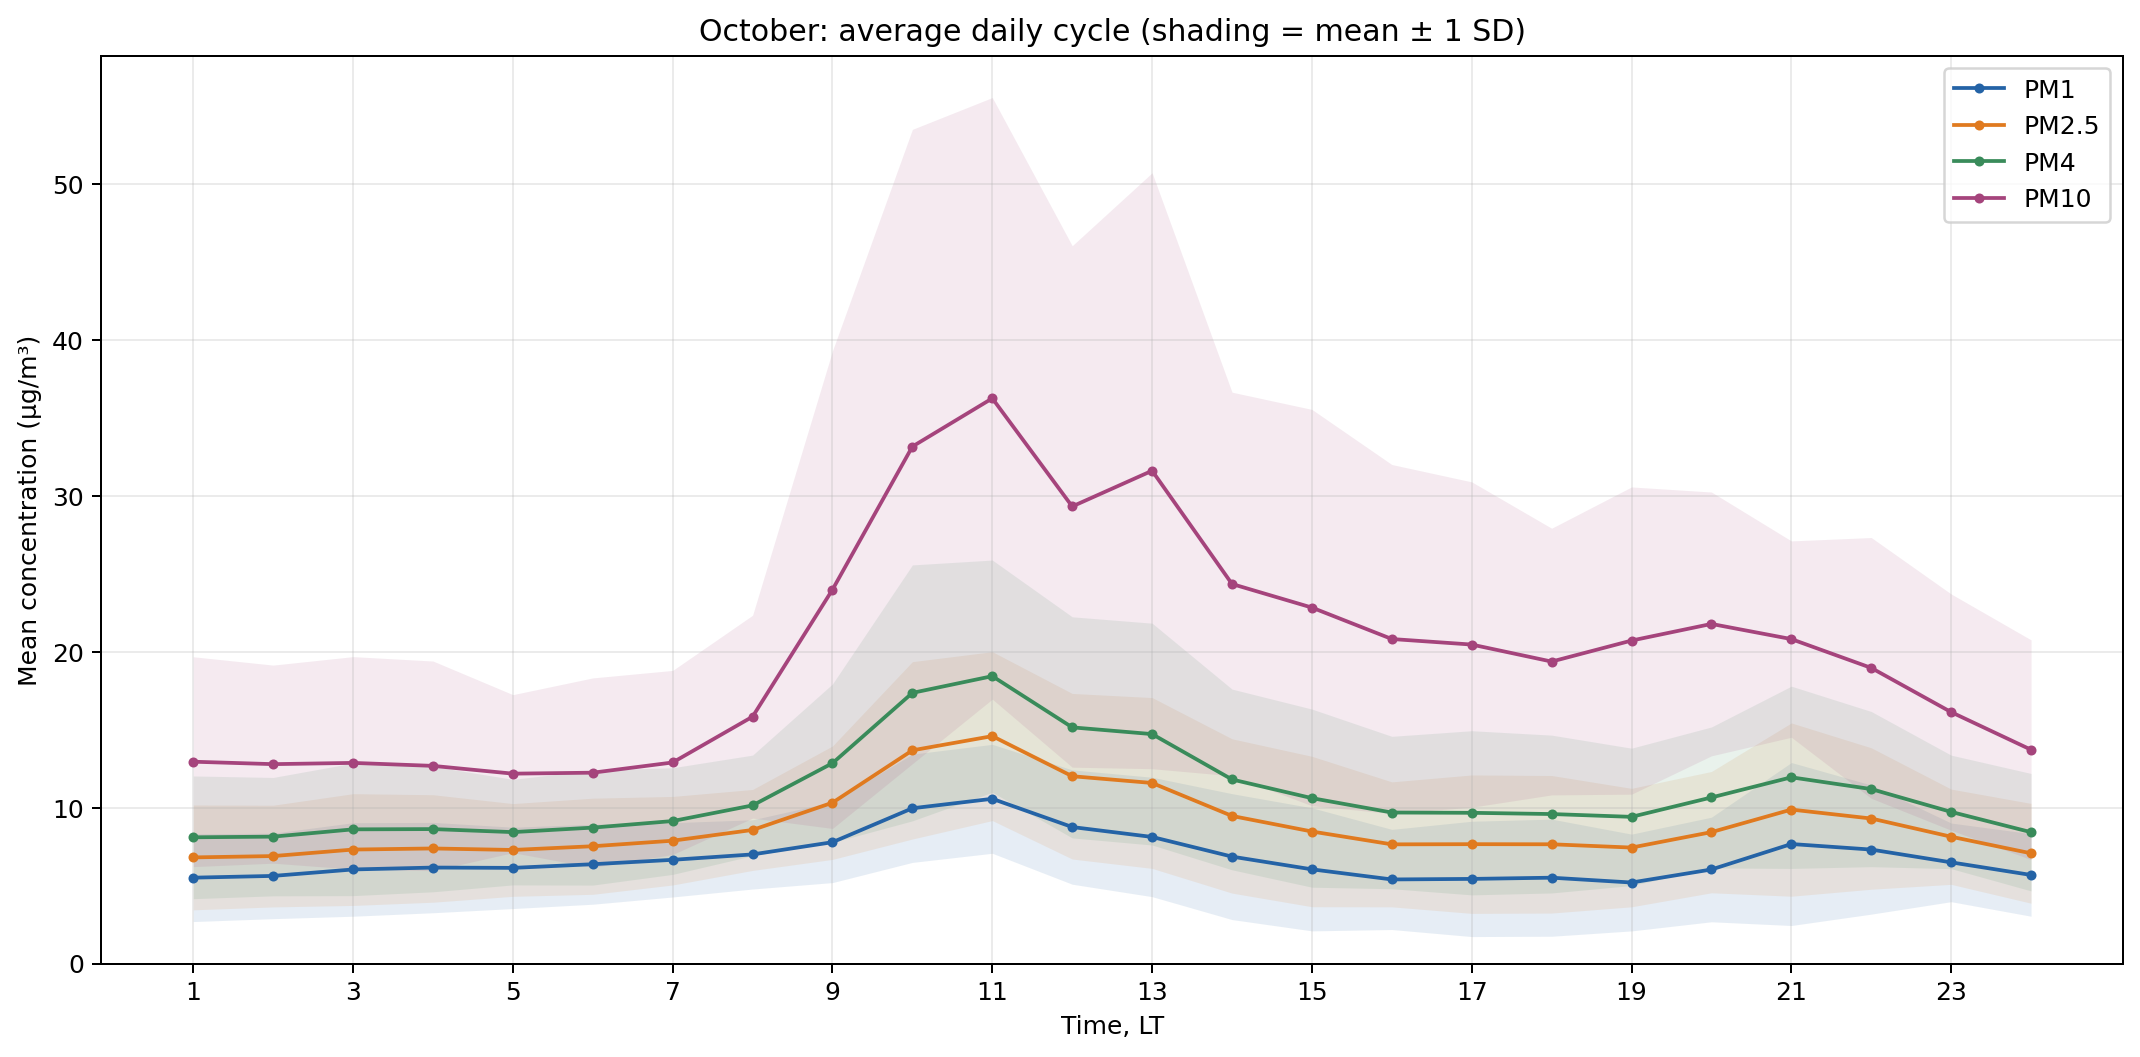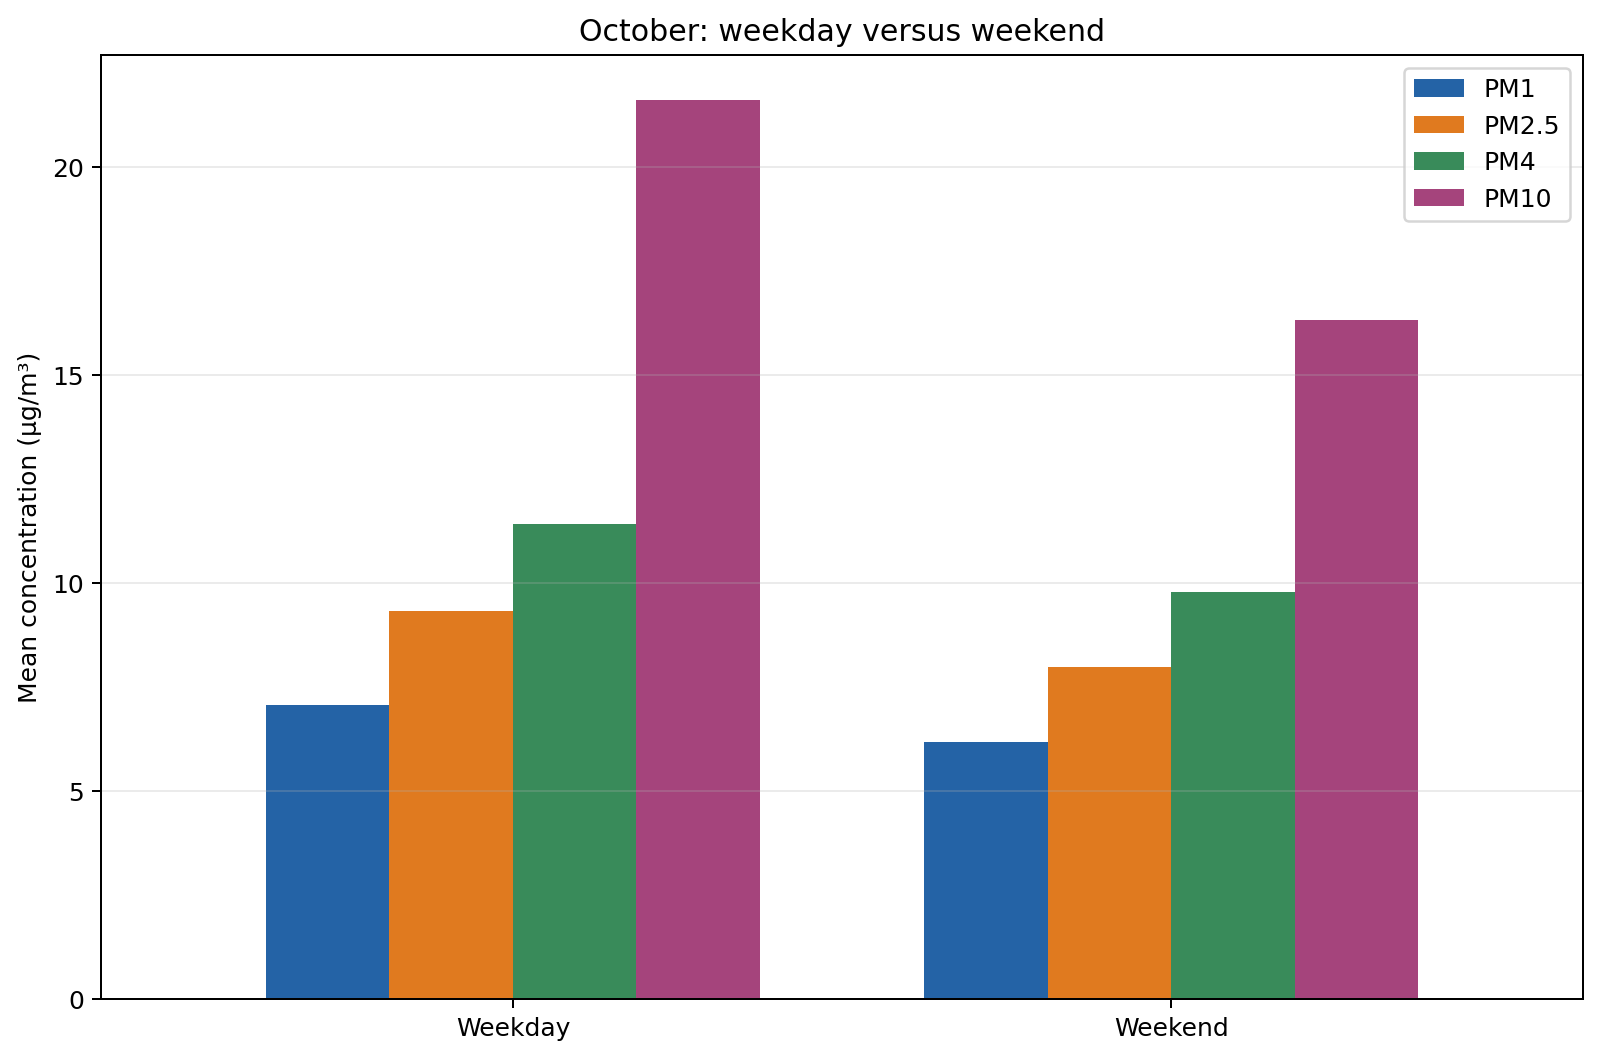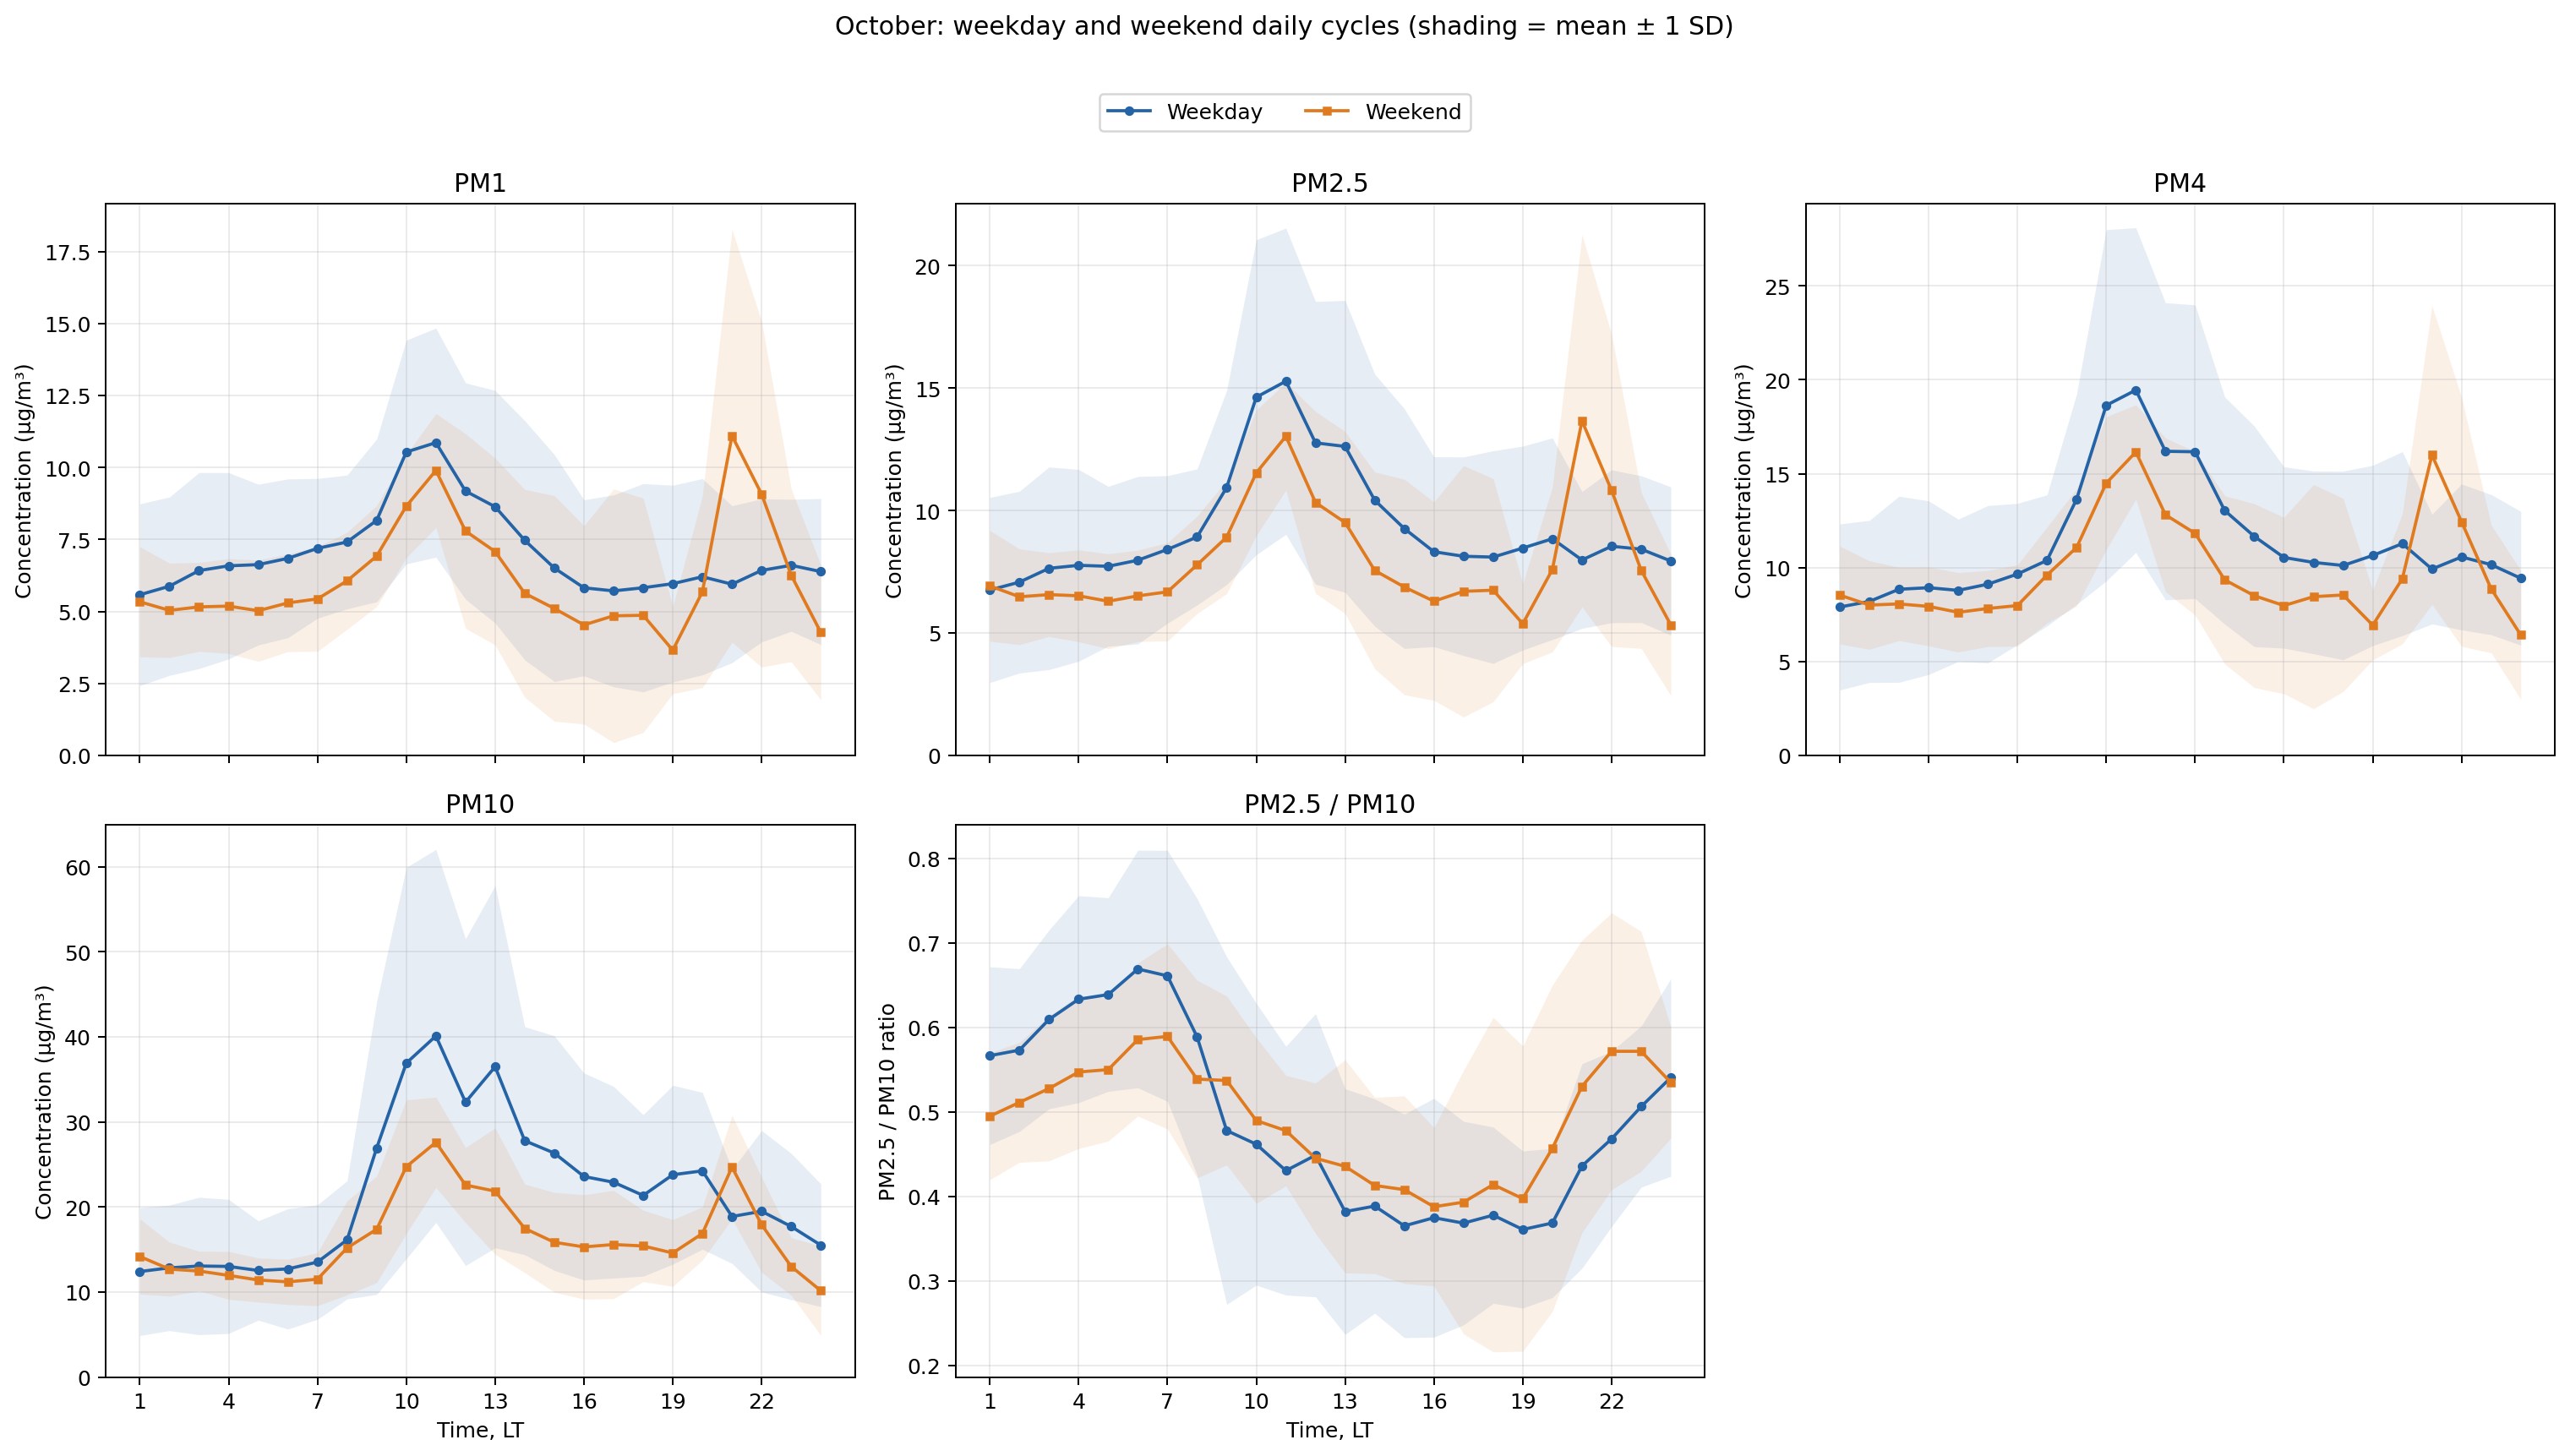
2025 retains all original averaged export records, including irregular durations; 2024/2026 retain nominal quarter-hour observations. Europe/Sofia local time. Concentrations in µg/m³. Unknown valid-minute counts remain blank.
Coverage is the share of expected intervals containing a valid value; missing intervals were not imputed.
| Month | Name | PM1 | PM2.5 | PM4 | PM10 |
|---|---|---|---|---|---|
| 01 | January | 100.0% | 100.0% | 100.0% | 100.0% |
| 02 | February | 100.0% | 100.0% | 100.0% | 100.0% |
| 03 | March | 100.0% | 100.0% | 100.0% | 100.0% |
| 04 | April | 93.4% | 93.4% | 93.4% | 93.4% |
| 05 | May | 100.0% | 100.0% | 100.0% | 100.0% |
| 06 | June | 99.9% | 99.9% | 99.9% | 99.9% |
| 07 | July | 100.0% | 100.0% | 100.0% | 100.0% |
| 08 | August | 99.5% | 99.5% | 99.5% | 99.5% |
| 09 | September | 100.0% | 100.0% | 100.0% | 100.0% |
| 10 | October | 40.3% | 40.3% | 40.3% | 40.3% |
| 11 | November | 0.0% | 0.0% | 0.0% | 0.0% |
| 12 | December | 0.0% | 0.0% | 0.0% | 0.0% |
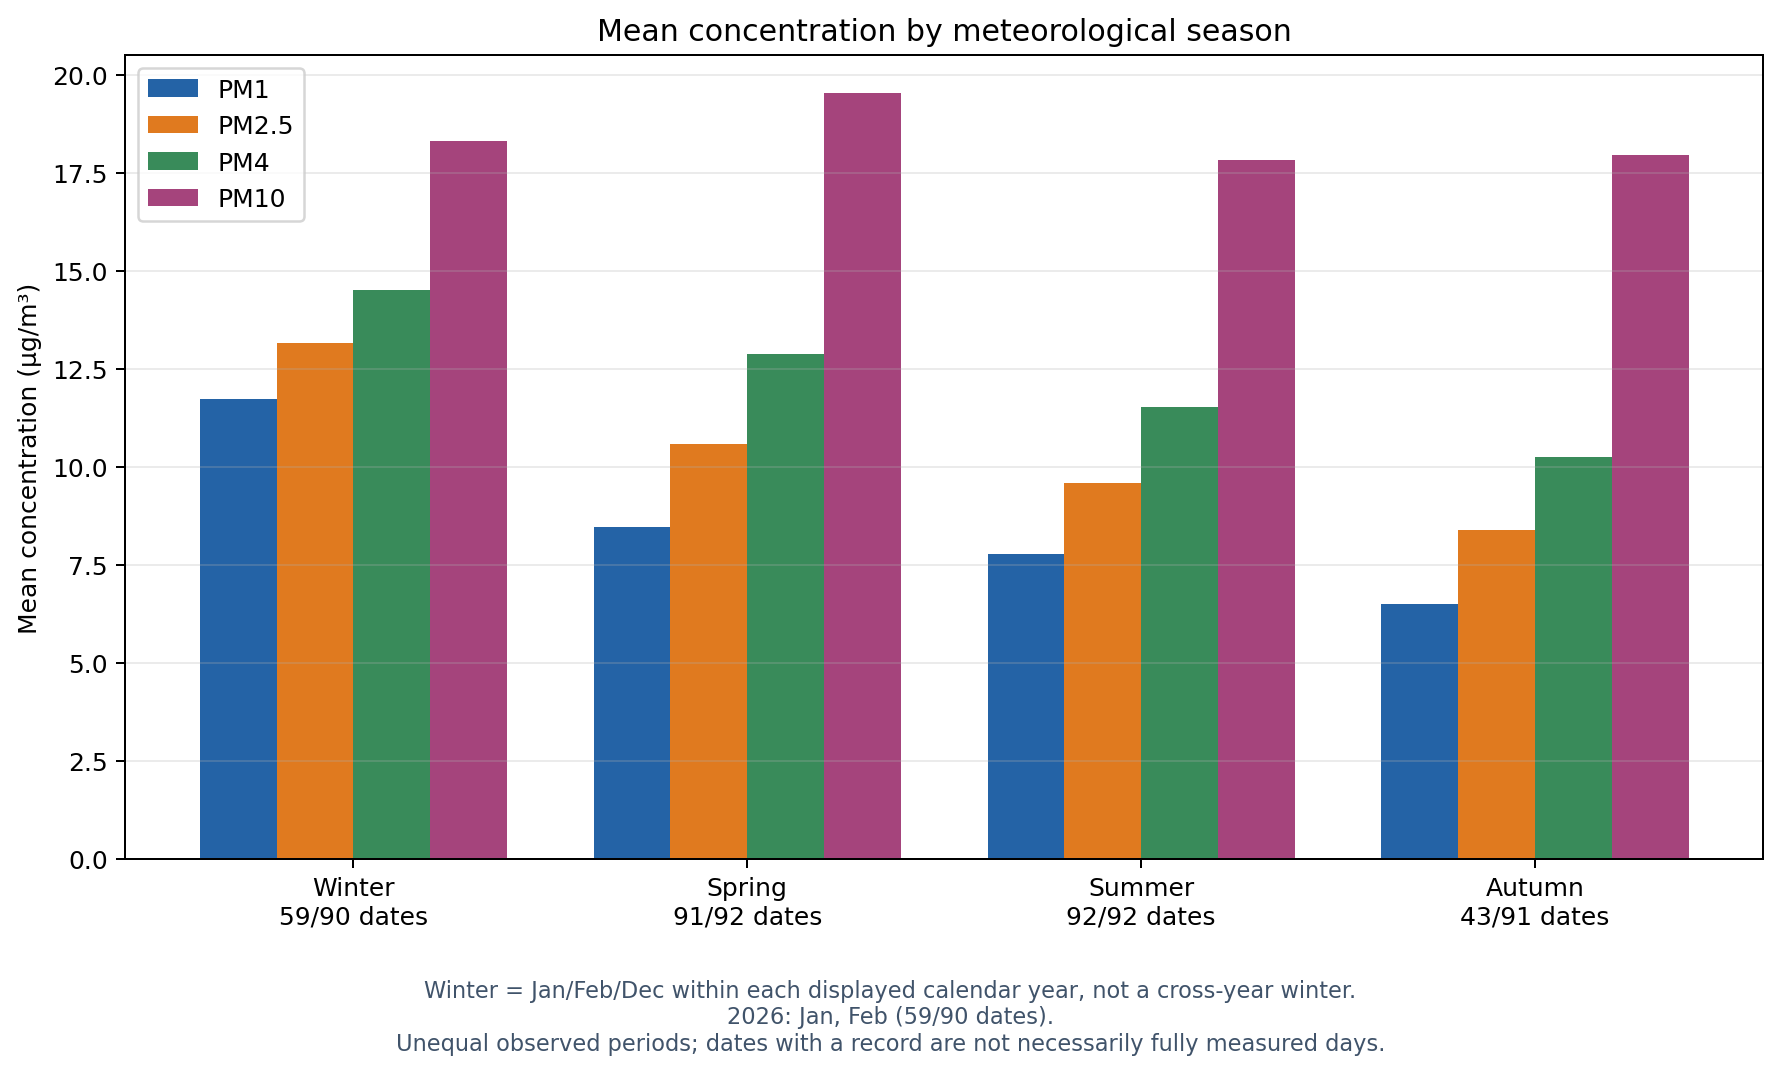
Winter groups January, February and December of the displayed calendar year, not December of the preceding year. Partial calendar seasons must not be compared as equivalent complete seasons. Dates below have at least one valid PM record; this does not imply full-day coverage. Period ranges may contain internal gaps. Monthly interval coverage is reported separately.
| Year | Season | Observed local periods | PM records | Dates observed / calendar dates | Coverage status |
|---|---|---|---|---|---|
| 2026 | Winter | Jan 2026; Feb 2026 | 5,664 | 59/90 | Partial calendar season |
| 2026 | Spring | Mar 2026; 01-05, 07-30 Apr 2026; May 2026 | 8,637 | 91/92 | Partial calendar season |
| 2026 | Summer | Jun 2026; Jul 2026; Aug 2026 | 8,815 | 92/92 | All dates represented; check interval coverage |
| 2026 | Autumn | Sep 2026; 01-13 Oct 2026 | 4,080 | 43/91 | Partial calendar season |
Download observed season periods and date counts.
| Fraction | Count | Mean | Median | Std. dev. | Min | Max |
|---|---|---|---|---|---|---|
| PM1 | 27,196 | 8.620 | 7.227 | 6.143 | 0.014 | 100.192 |
| PM2.5 | 27,196 | 10.475 | 8.949 | 6.807 | 0.014 | 103.891 |
| PM4 | 27,196 | 12.381 | 10.580 | 7.735 | 0.014 | 107.123 |
| PM10 | 27,196 | 18.485 | 16.005 | 11.375 | 0.014 | 204.840 |
All concentrations are reported in µg/m³.
Concentration means give equal weight to each retained analytical record: sum of values / count. Standard deviation uses the sample formula (N-1 denominator) and describes variation between records, not uncertainty of the mean. Missing observations are never interpolated or replaced by zero; actual measured zeros remain included.
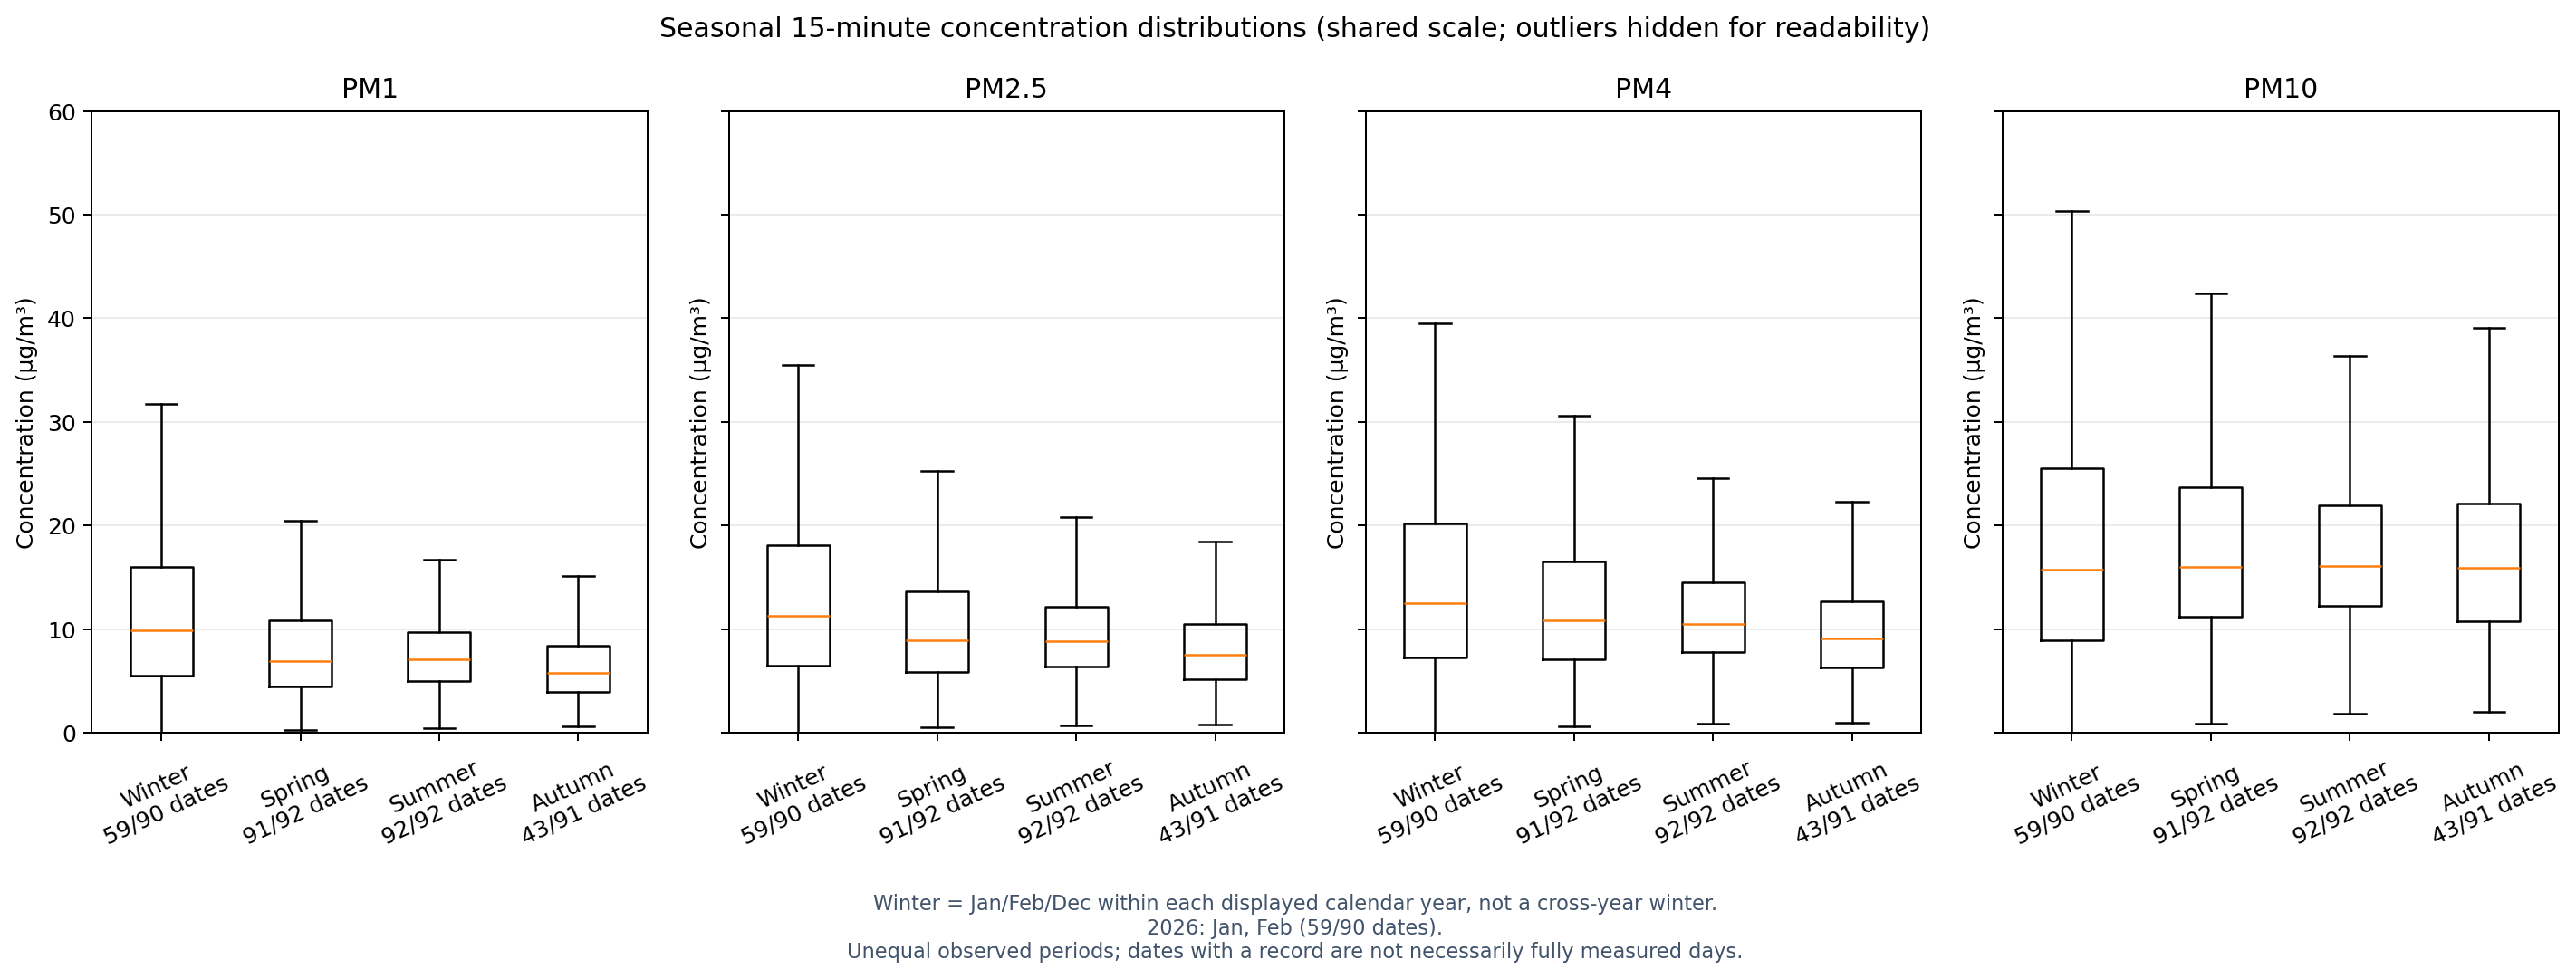
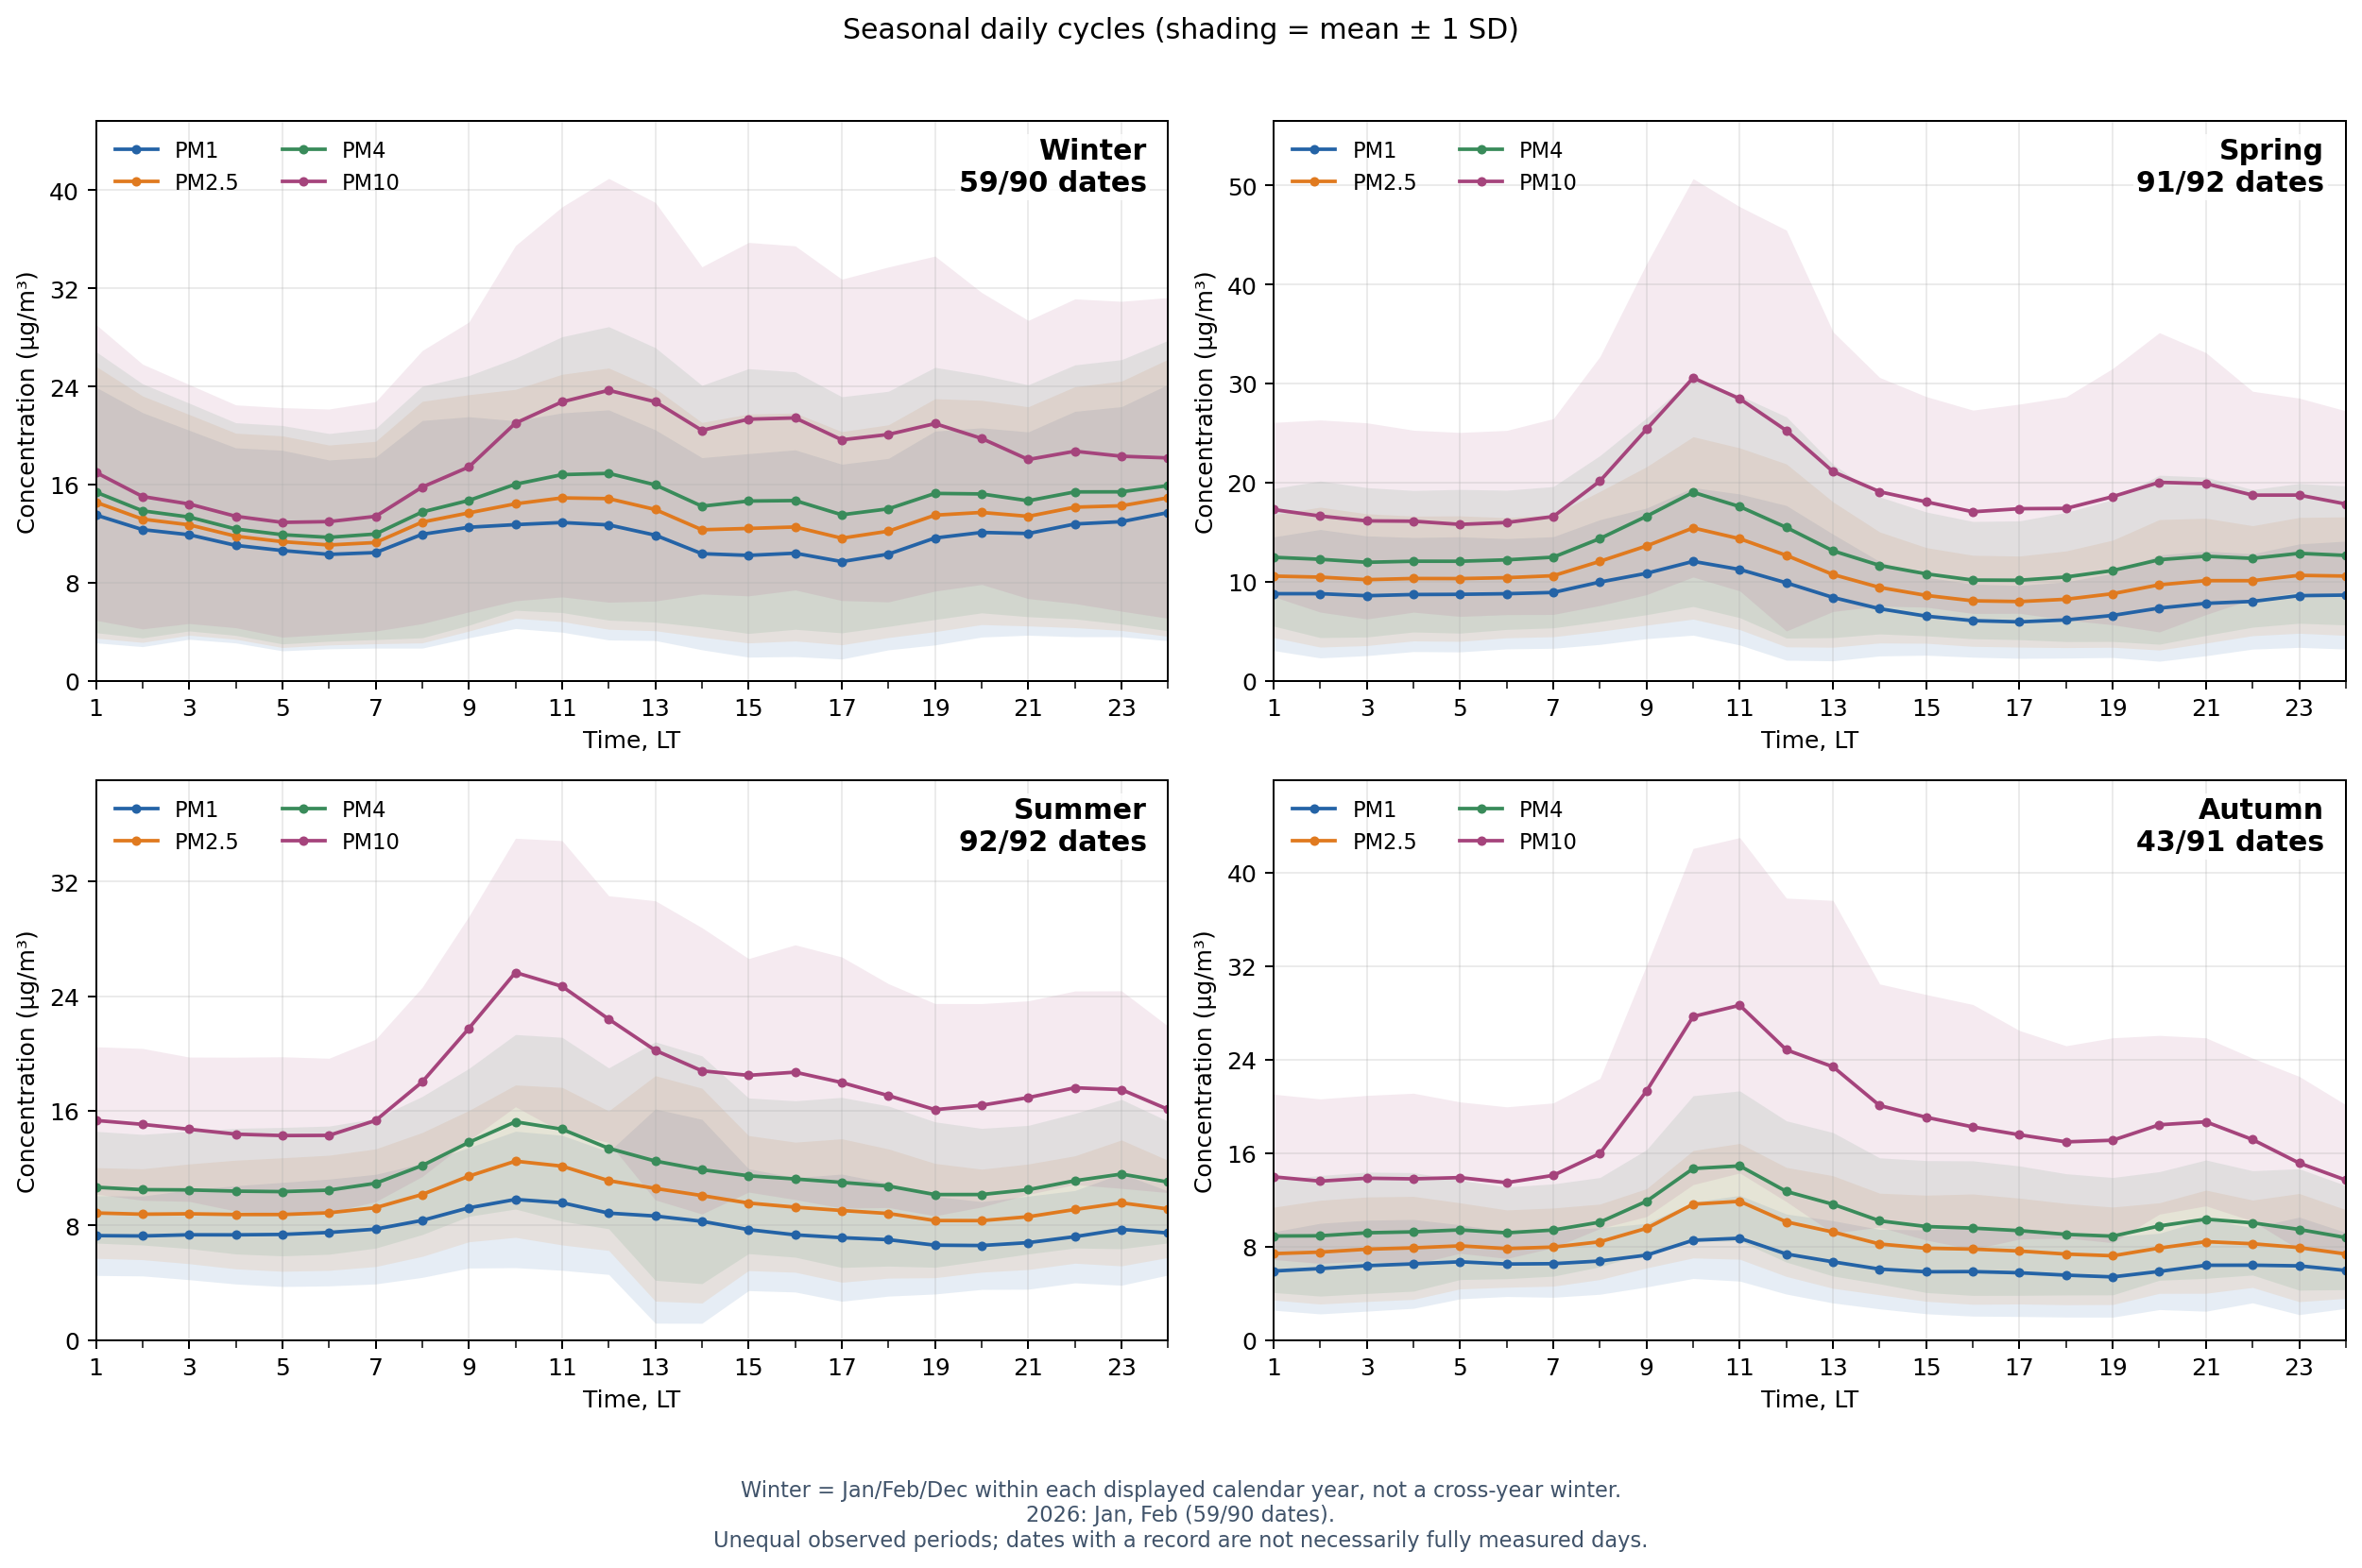
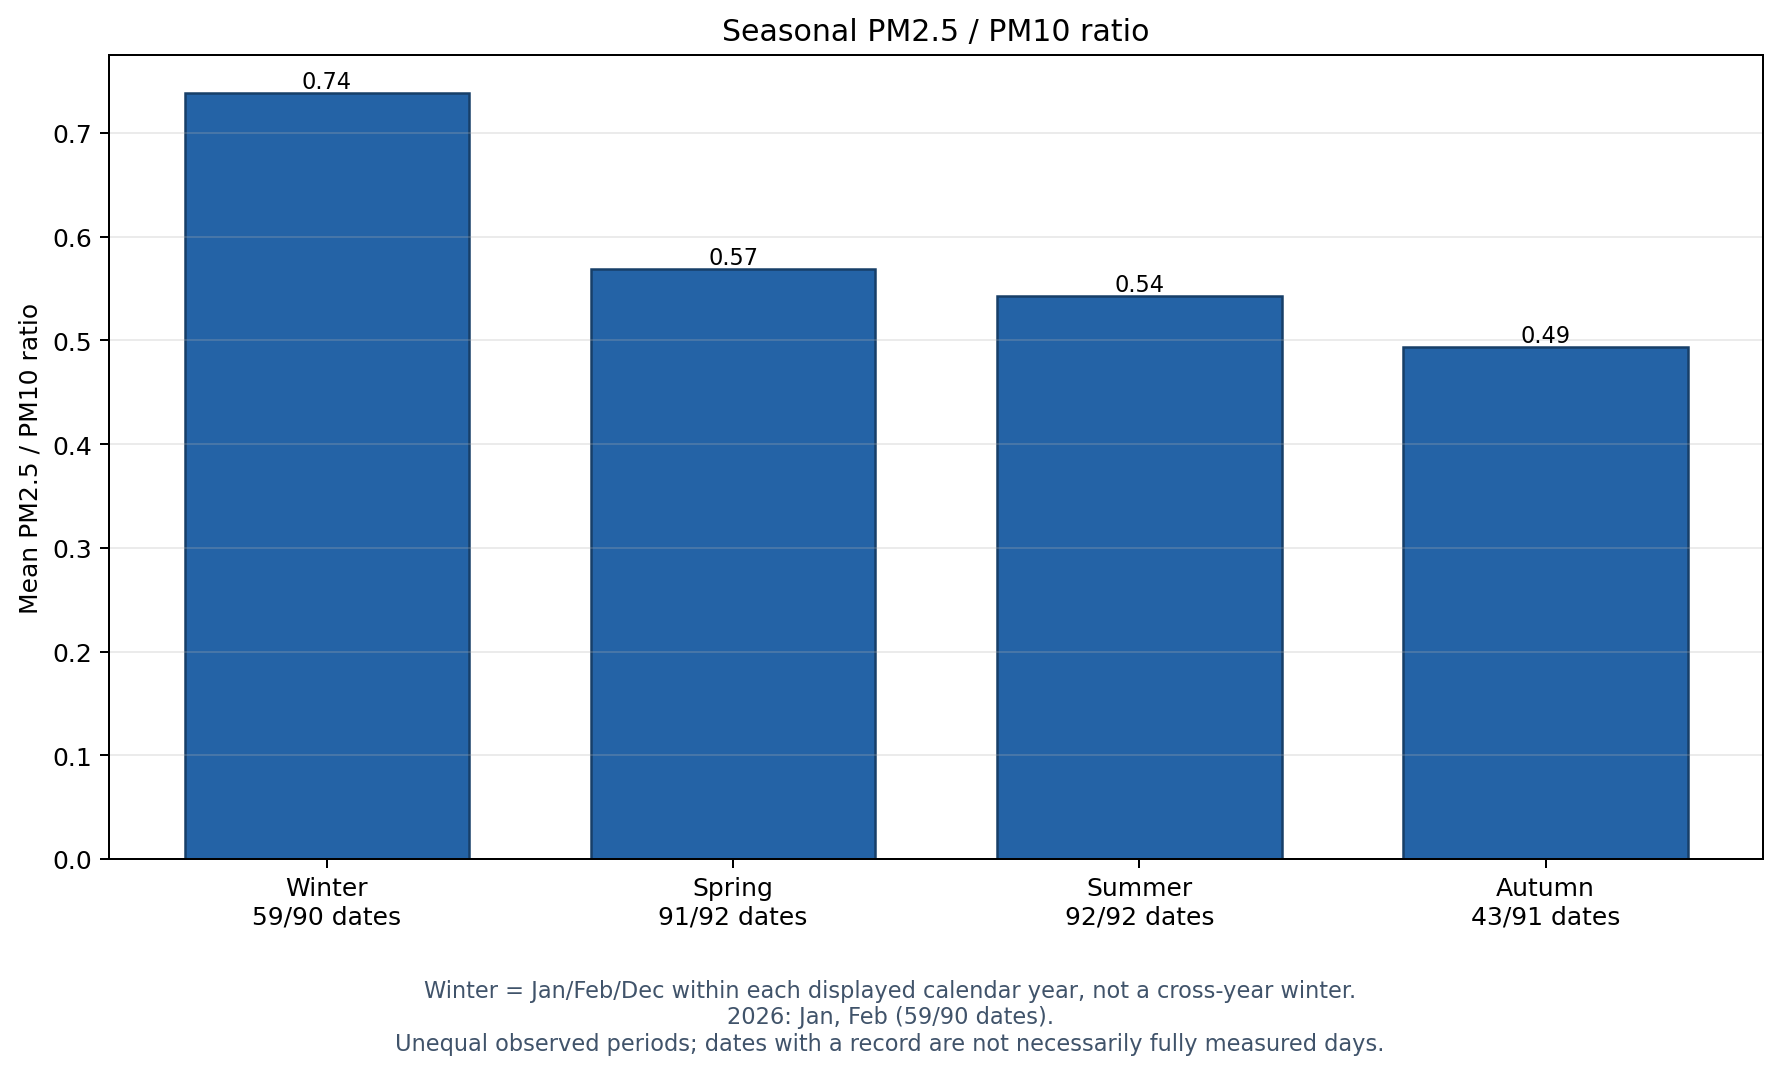
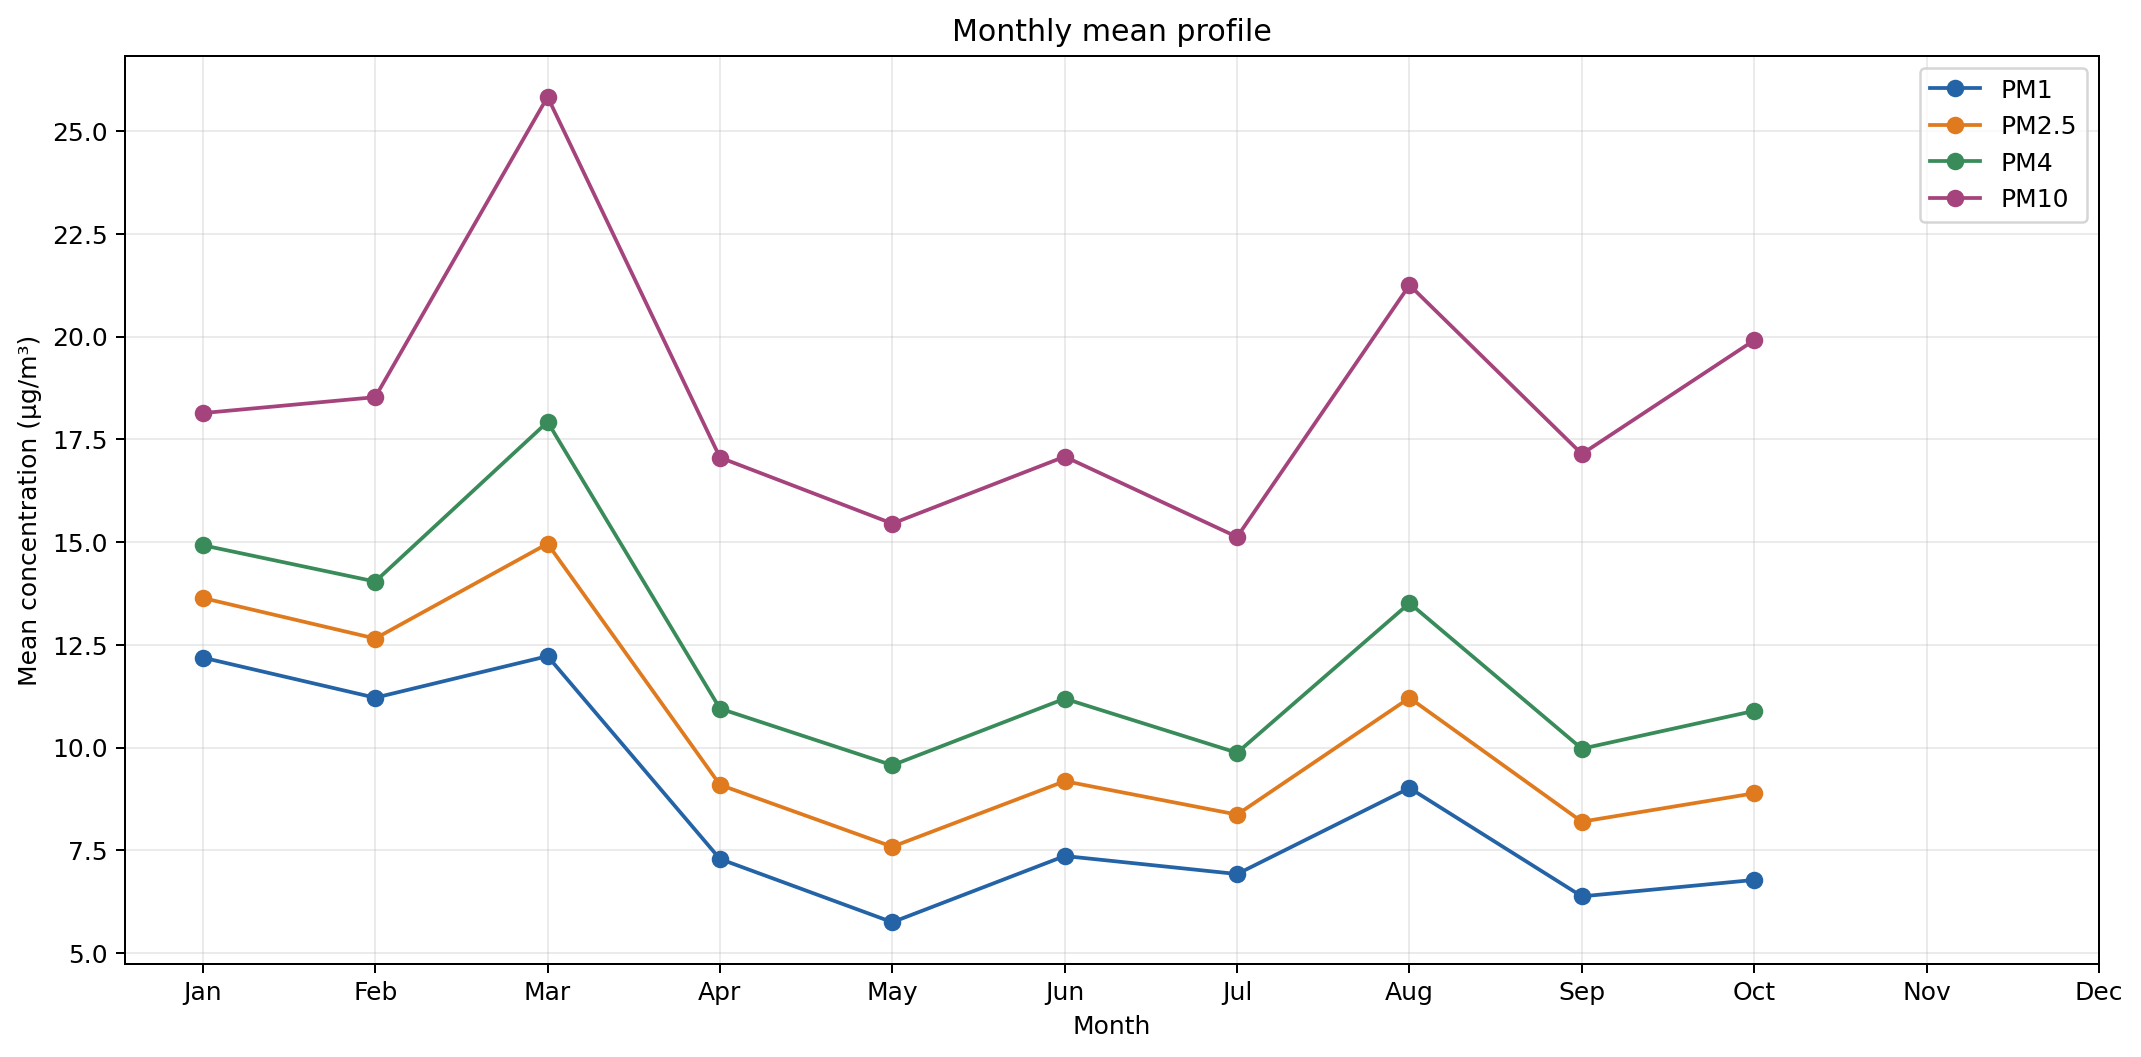
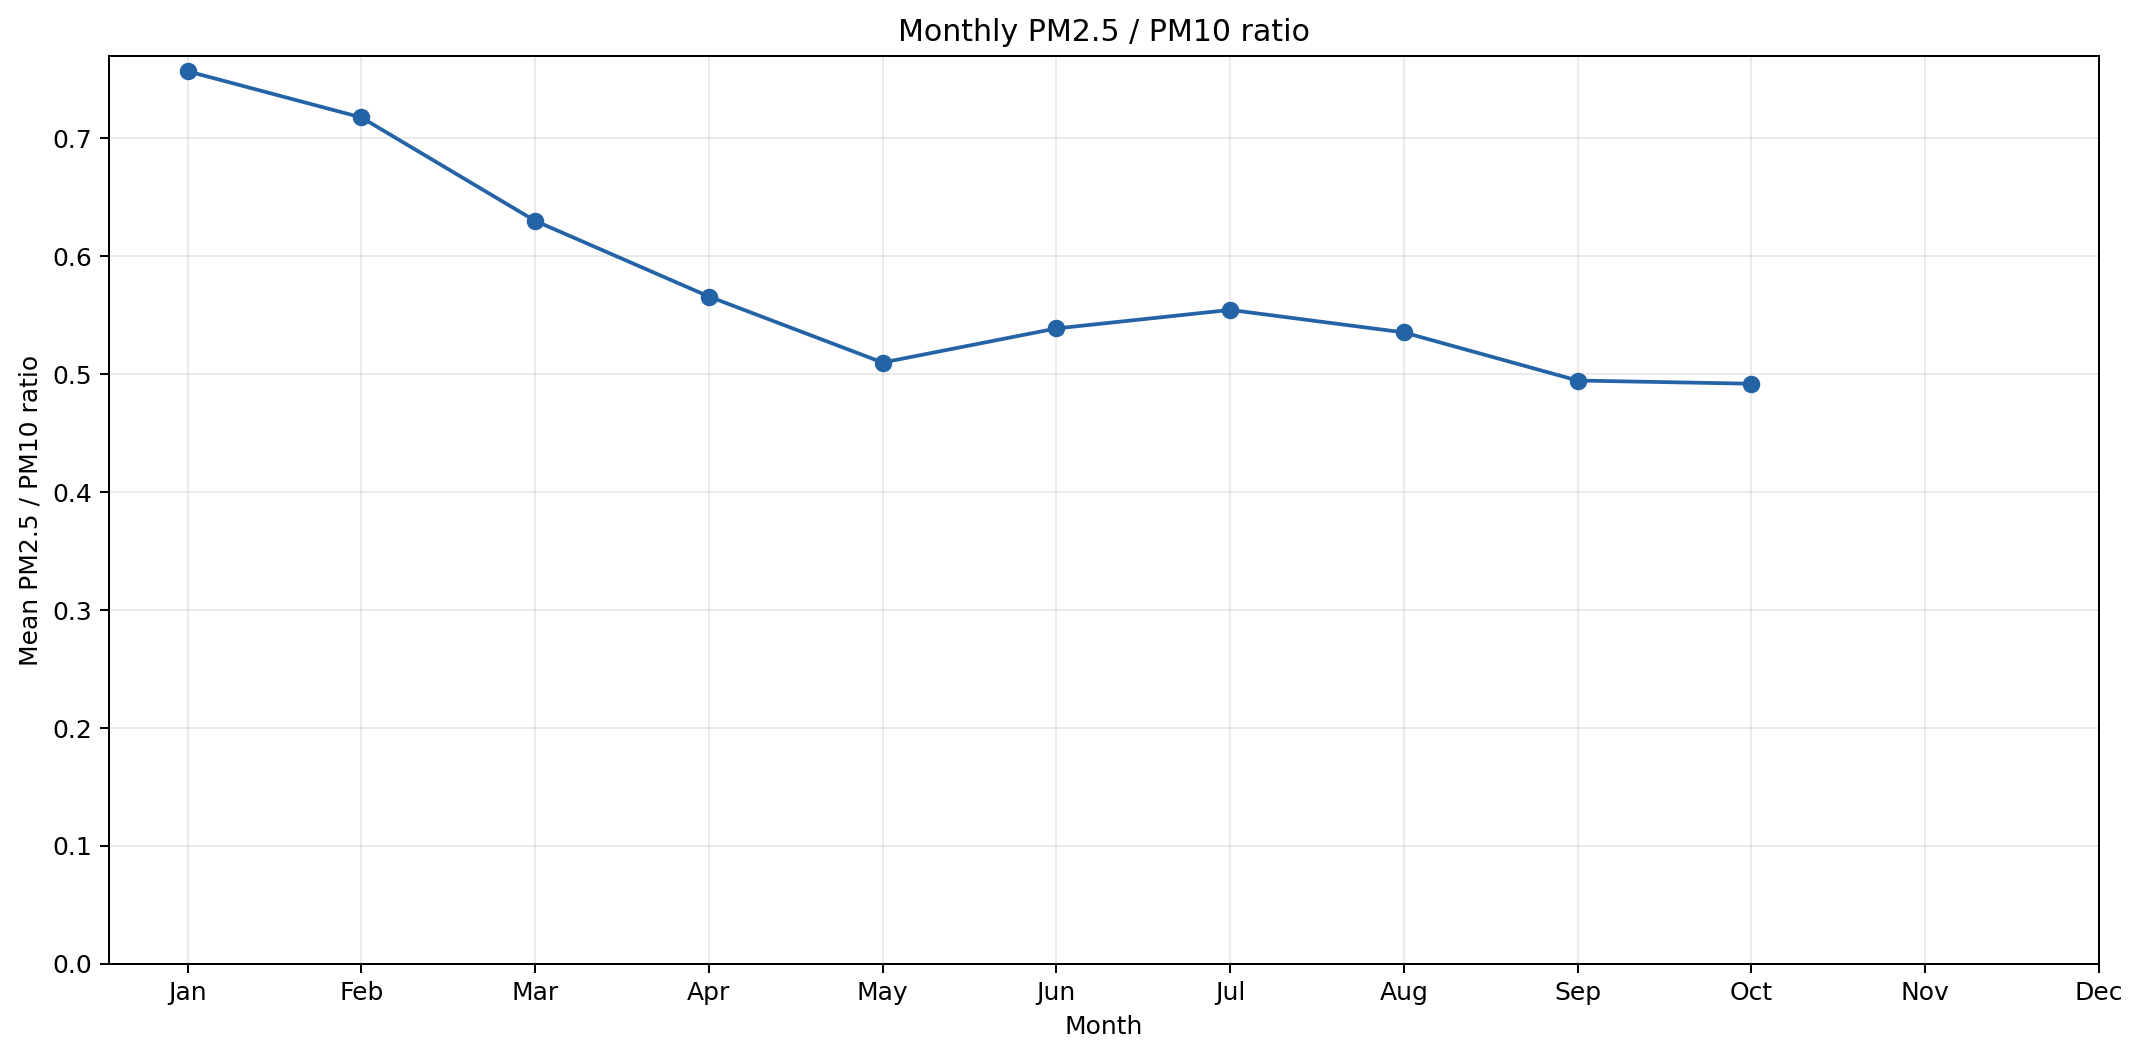
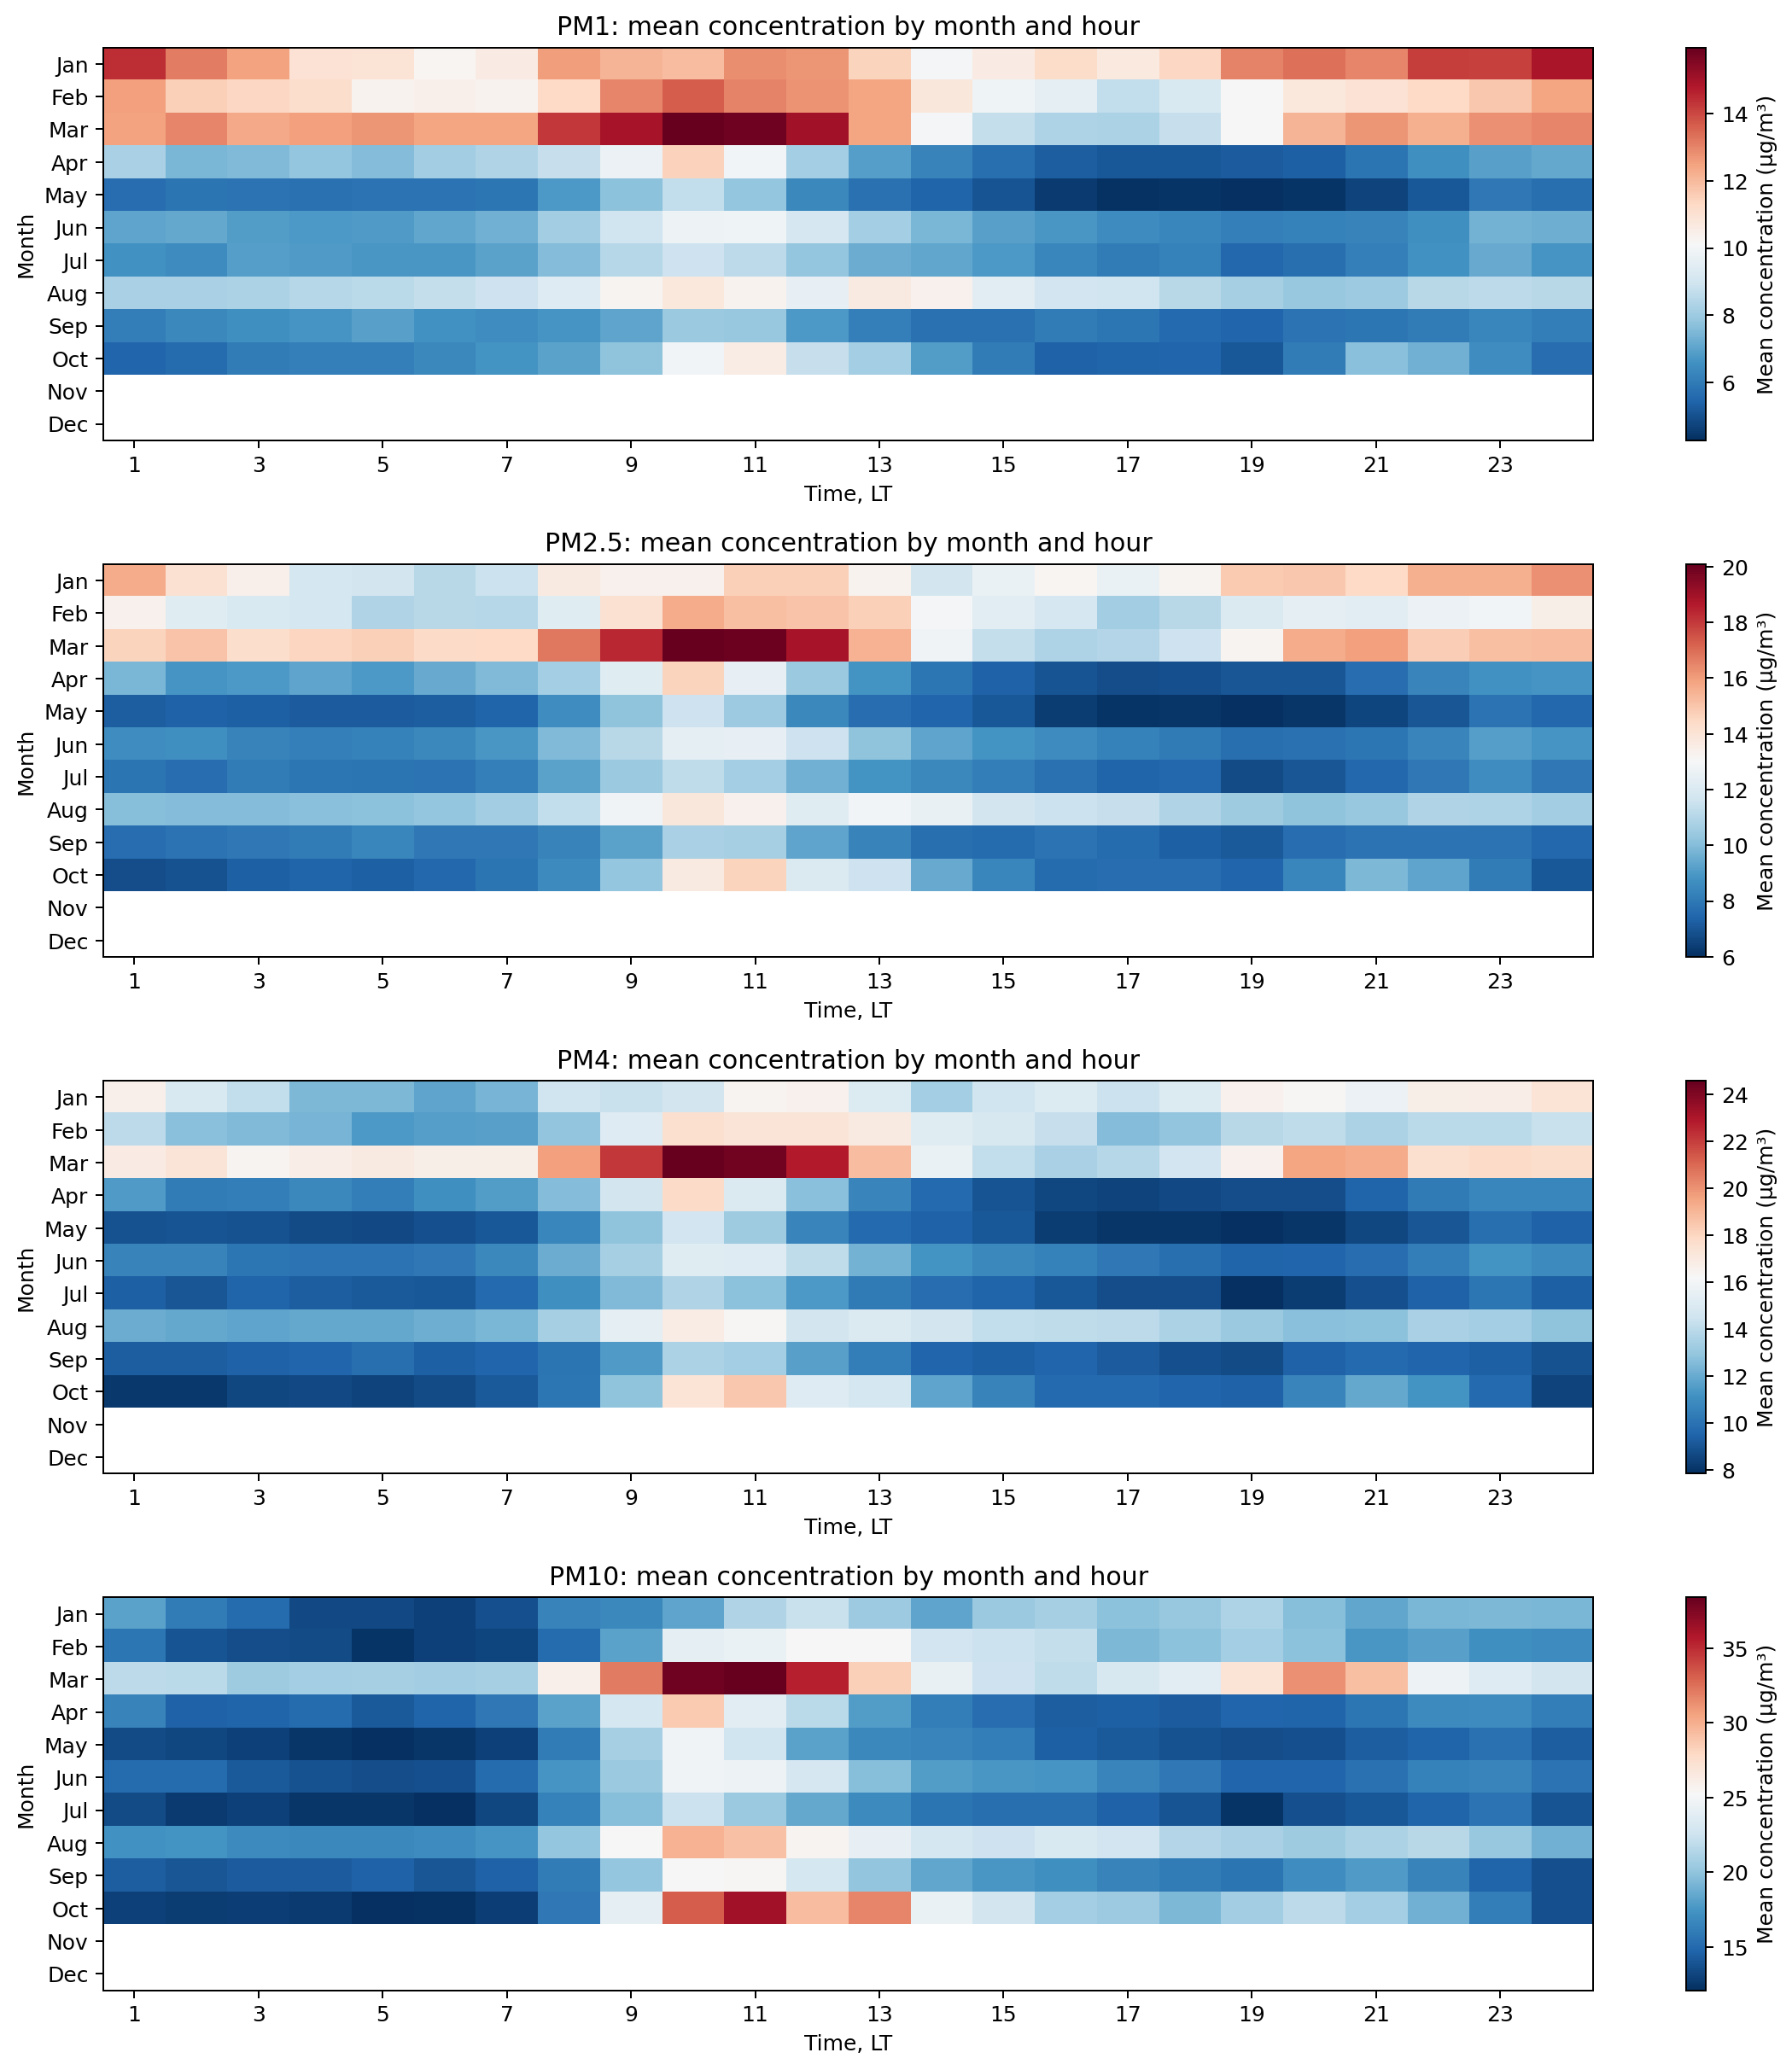
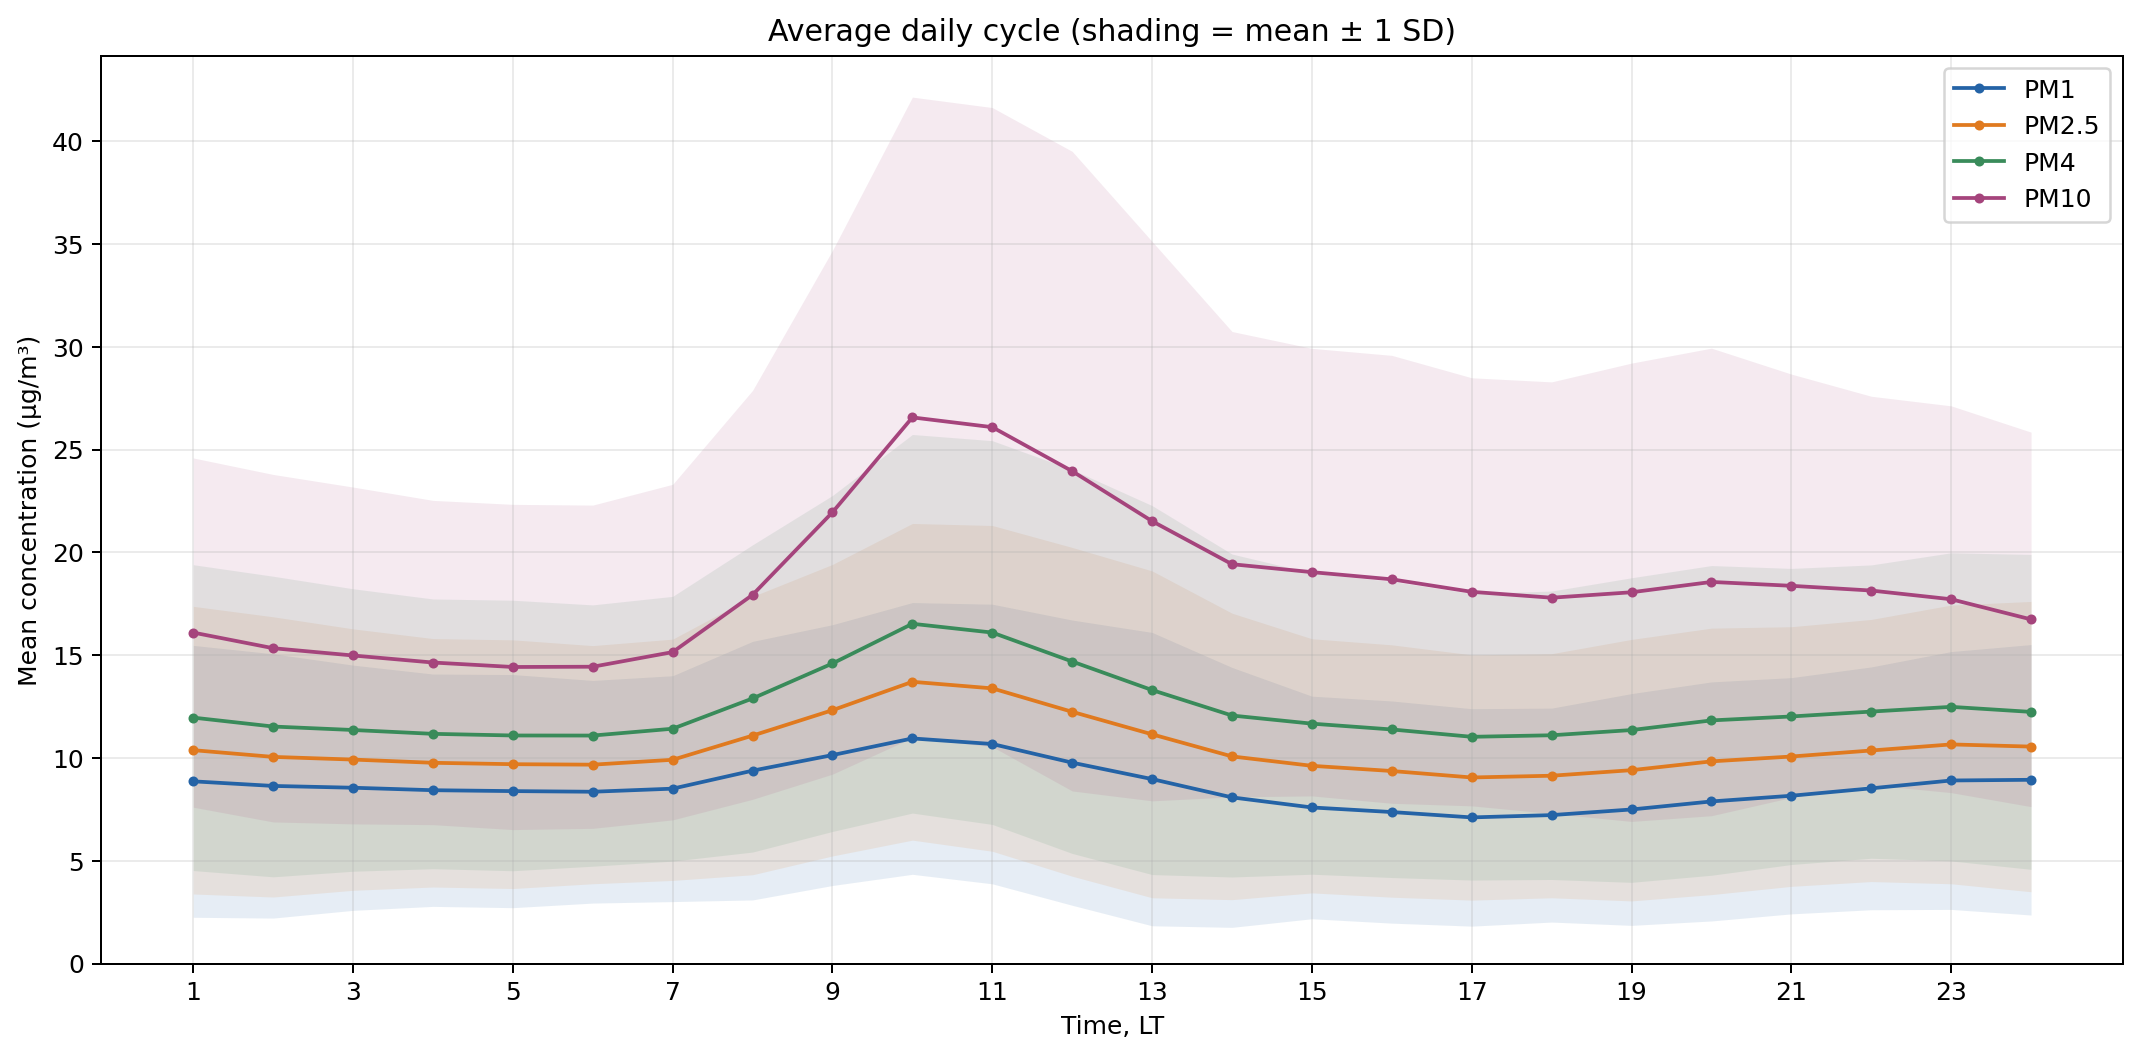
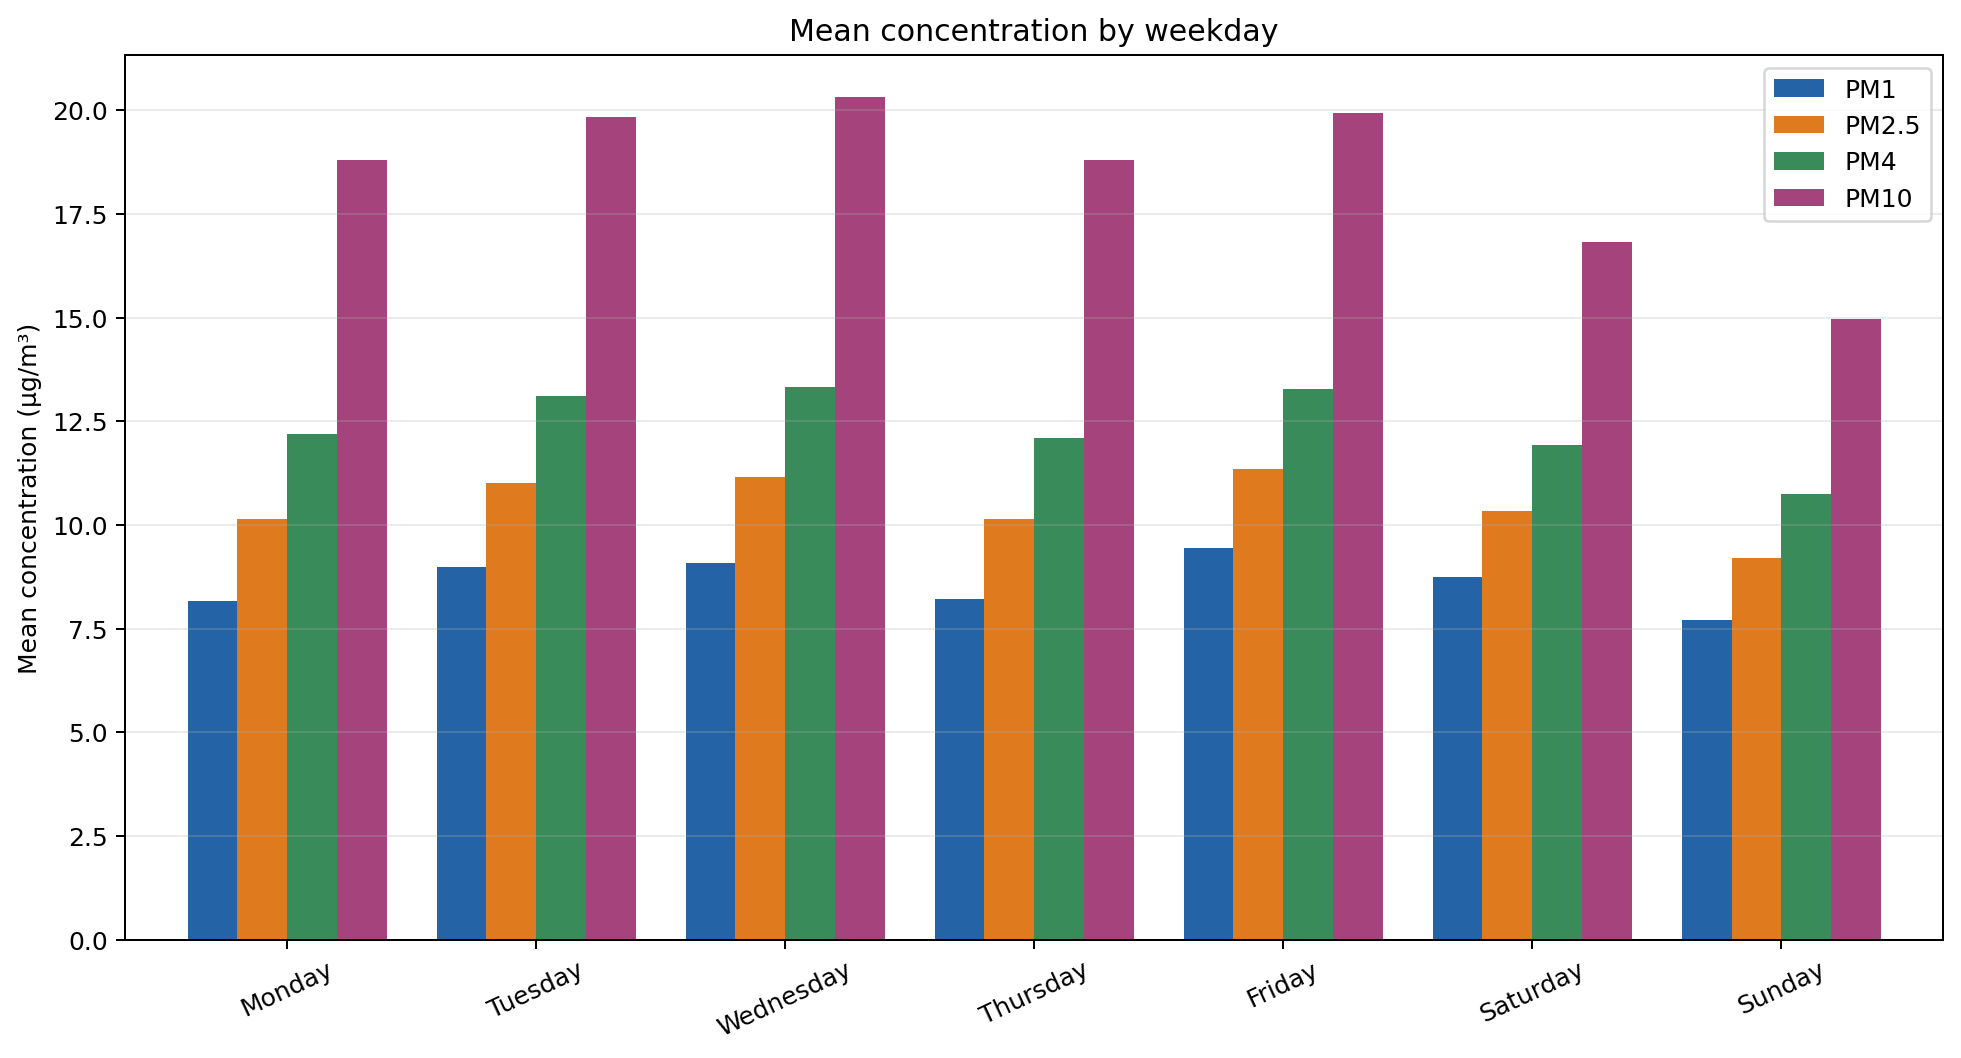
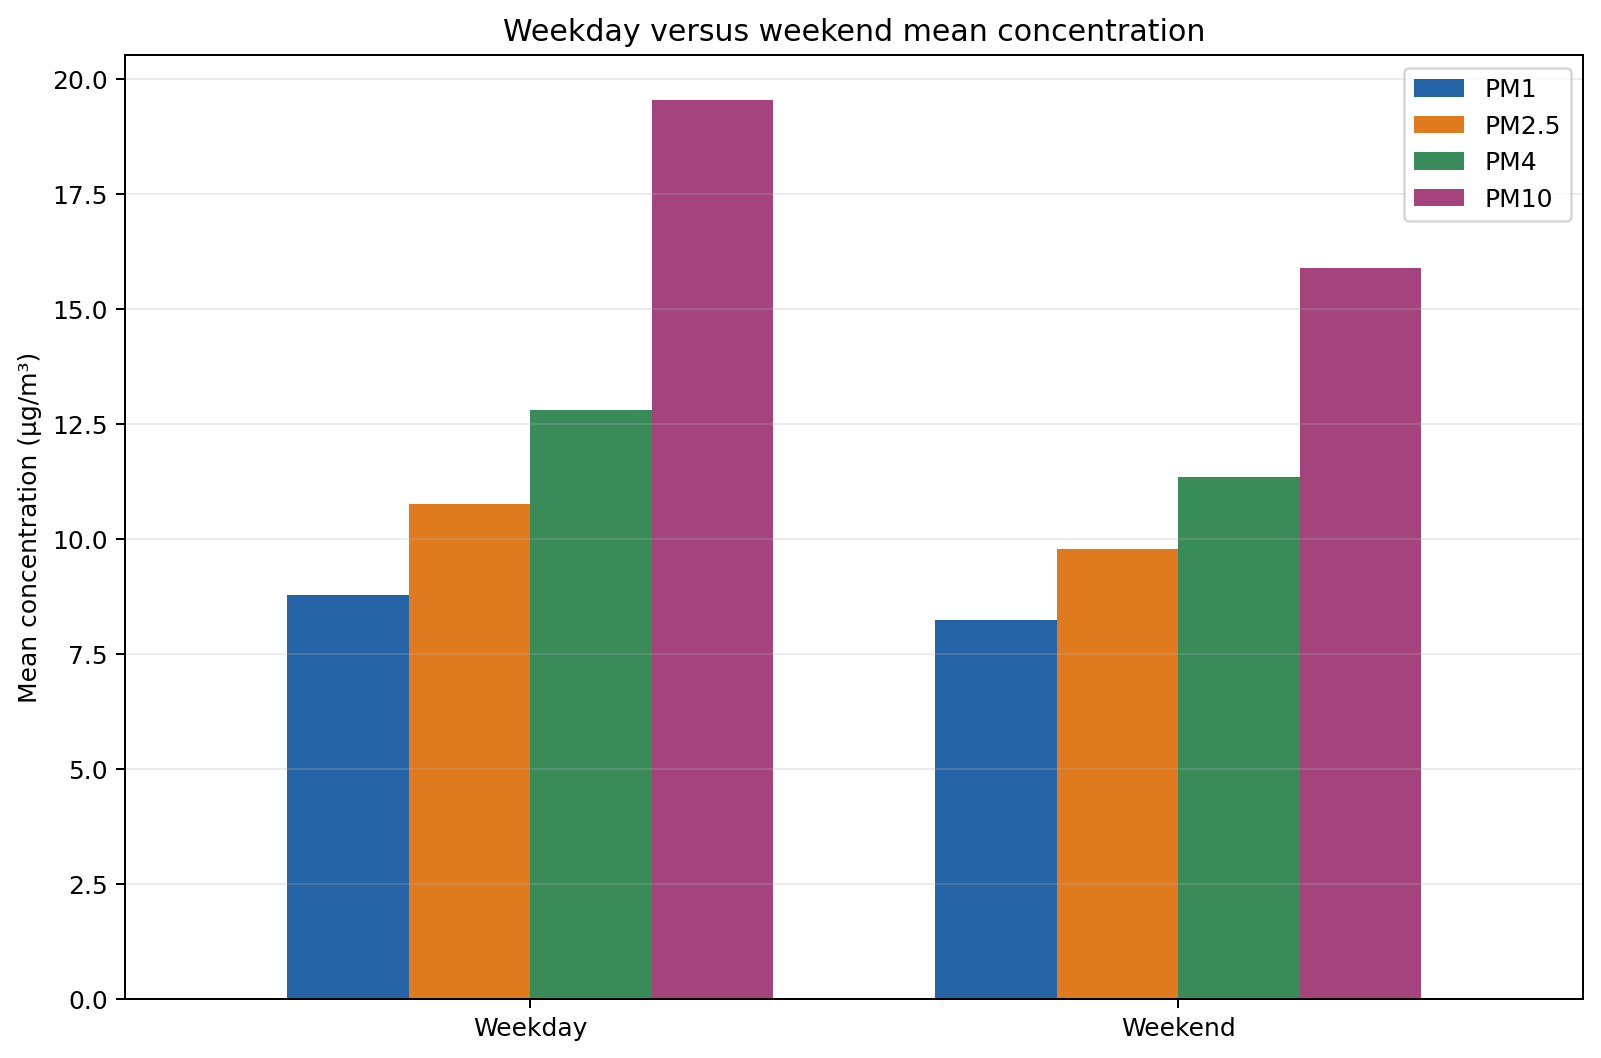
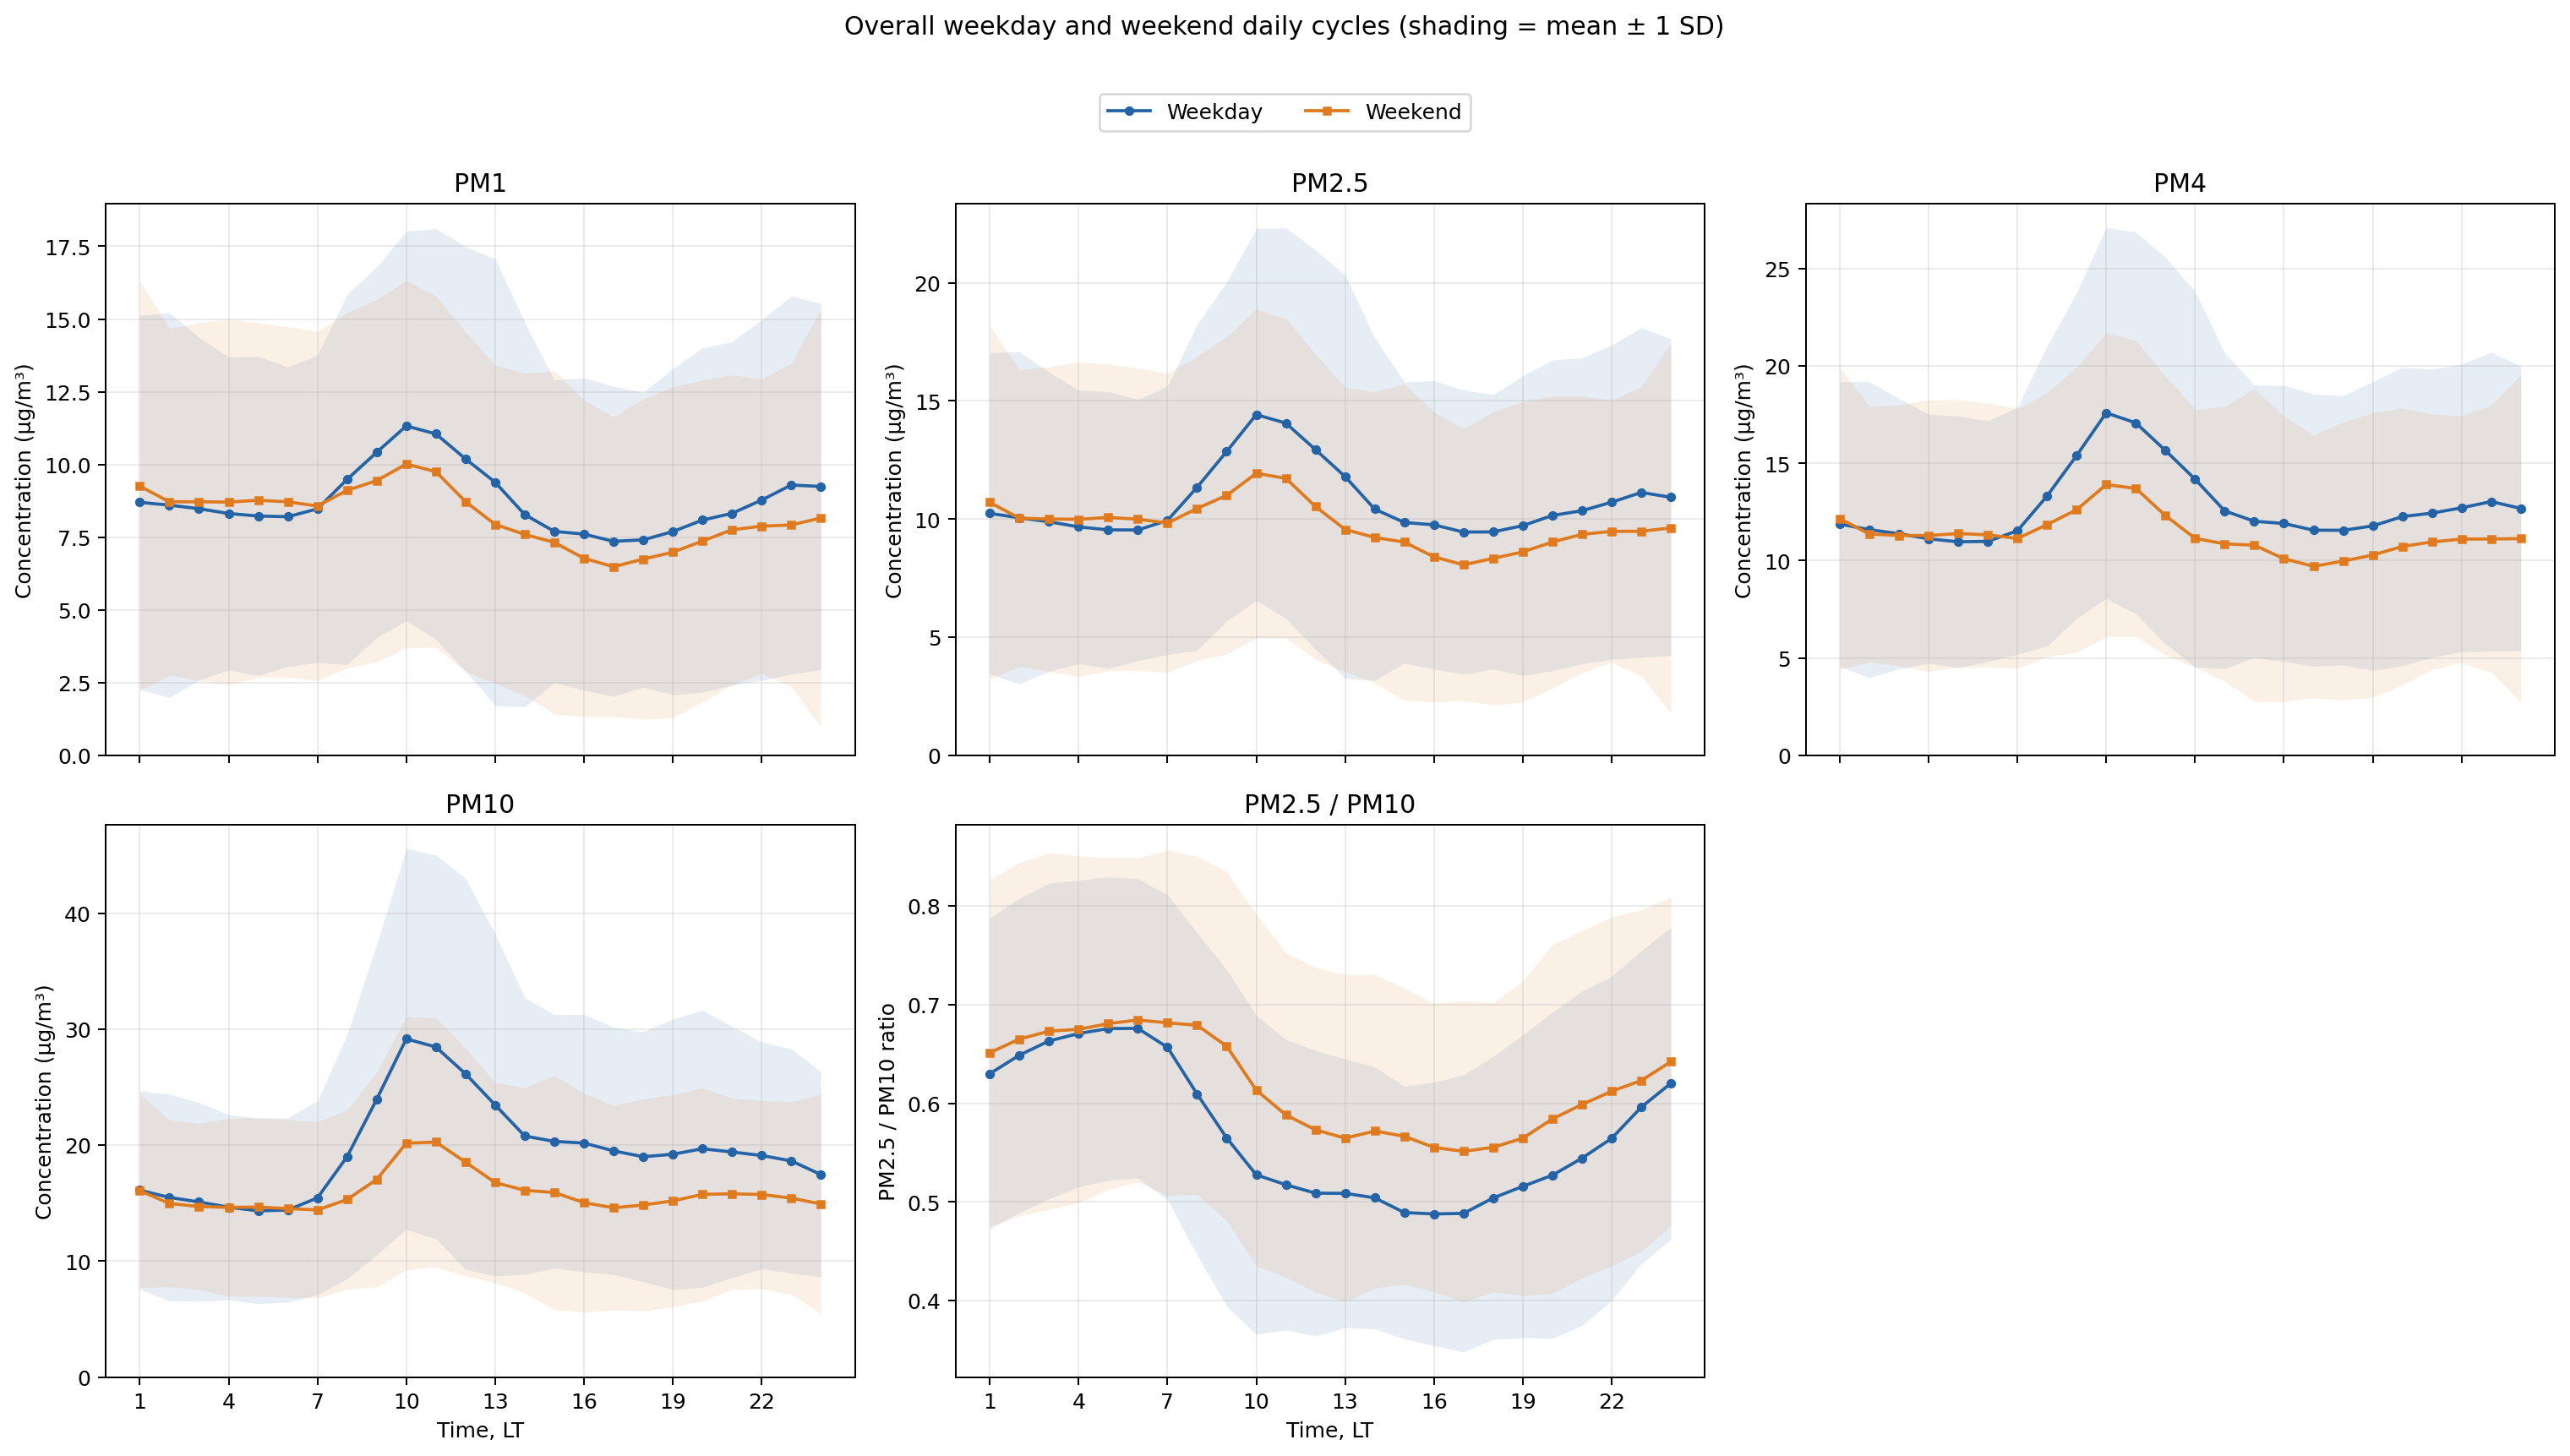
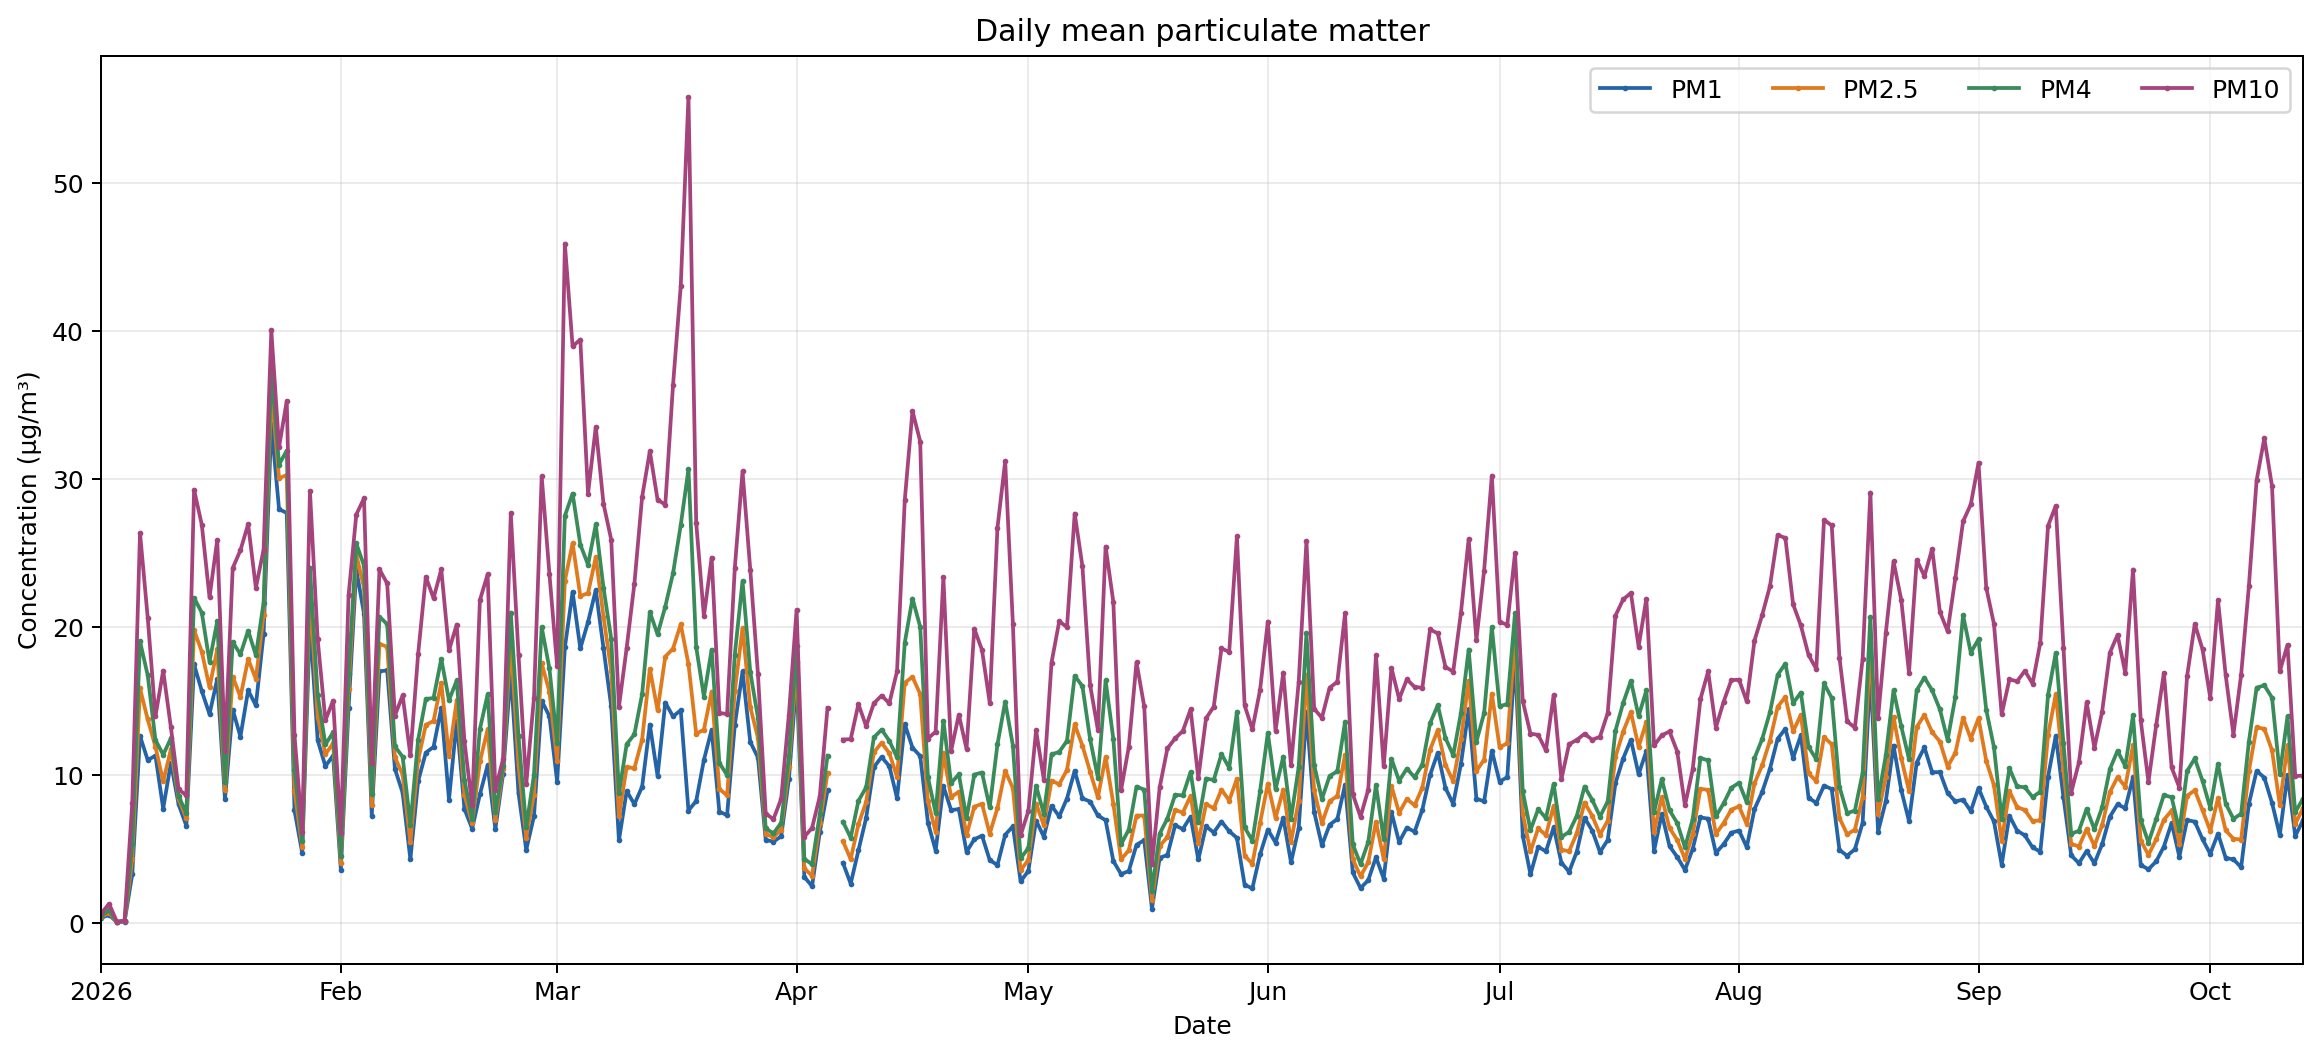
Separate graphs for each represented month are saved in the monthly_charts folder.
Meteorological seasons: Winter = Dec-Feb, Spring = Mar-May, Summer = Jun-Aug, Autumn = Sep-Nov. Weekends are Saturday and Sunday. Calendar grouping uses the local interval end. Hourly graphs use labels 1-24 based on the local interval start, so hour 15 represents 14:00-14:59. All charts use Europe/Sofia local time.